NBA Ticket Pricing Analysis
As my capstone project for the NBA Future Analytics Stars Program, I developed a predictive model for Chase Center ticket prices. Using two seasons of Golden State Warriors ticket sales data (provided by the NBA) along with additional external game data, I identified key factors influencing ticket demand and pricing. My project was selected as a finalist in the program’s capstone competition.
Result Highlights
Beyond seat location, several external factors significantly increased ticket prices:
- Better & big market opponents (playing the Lakers raised courside ticket prices by over $1,000)
- Availability of Steph Curry (his absence decreased average lower bowl ticket prices by about $15)
- Weekend games & earlier game times (both factors raised lower bowl ticket prices about $40)
- Purchasing further out from the game (gameday ticket prices dropped around $50 on average)
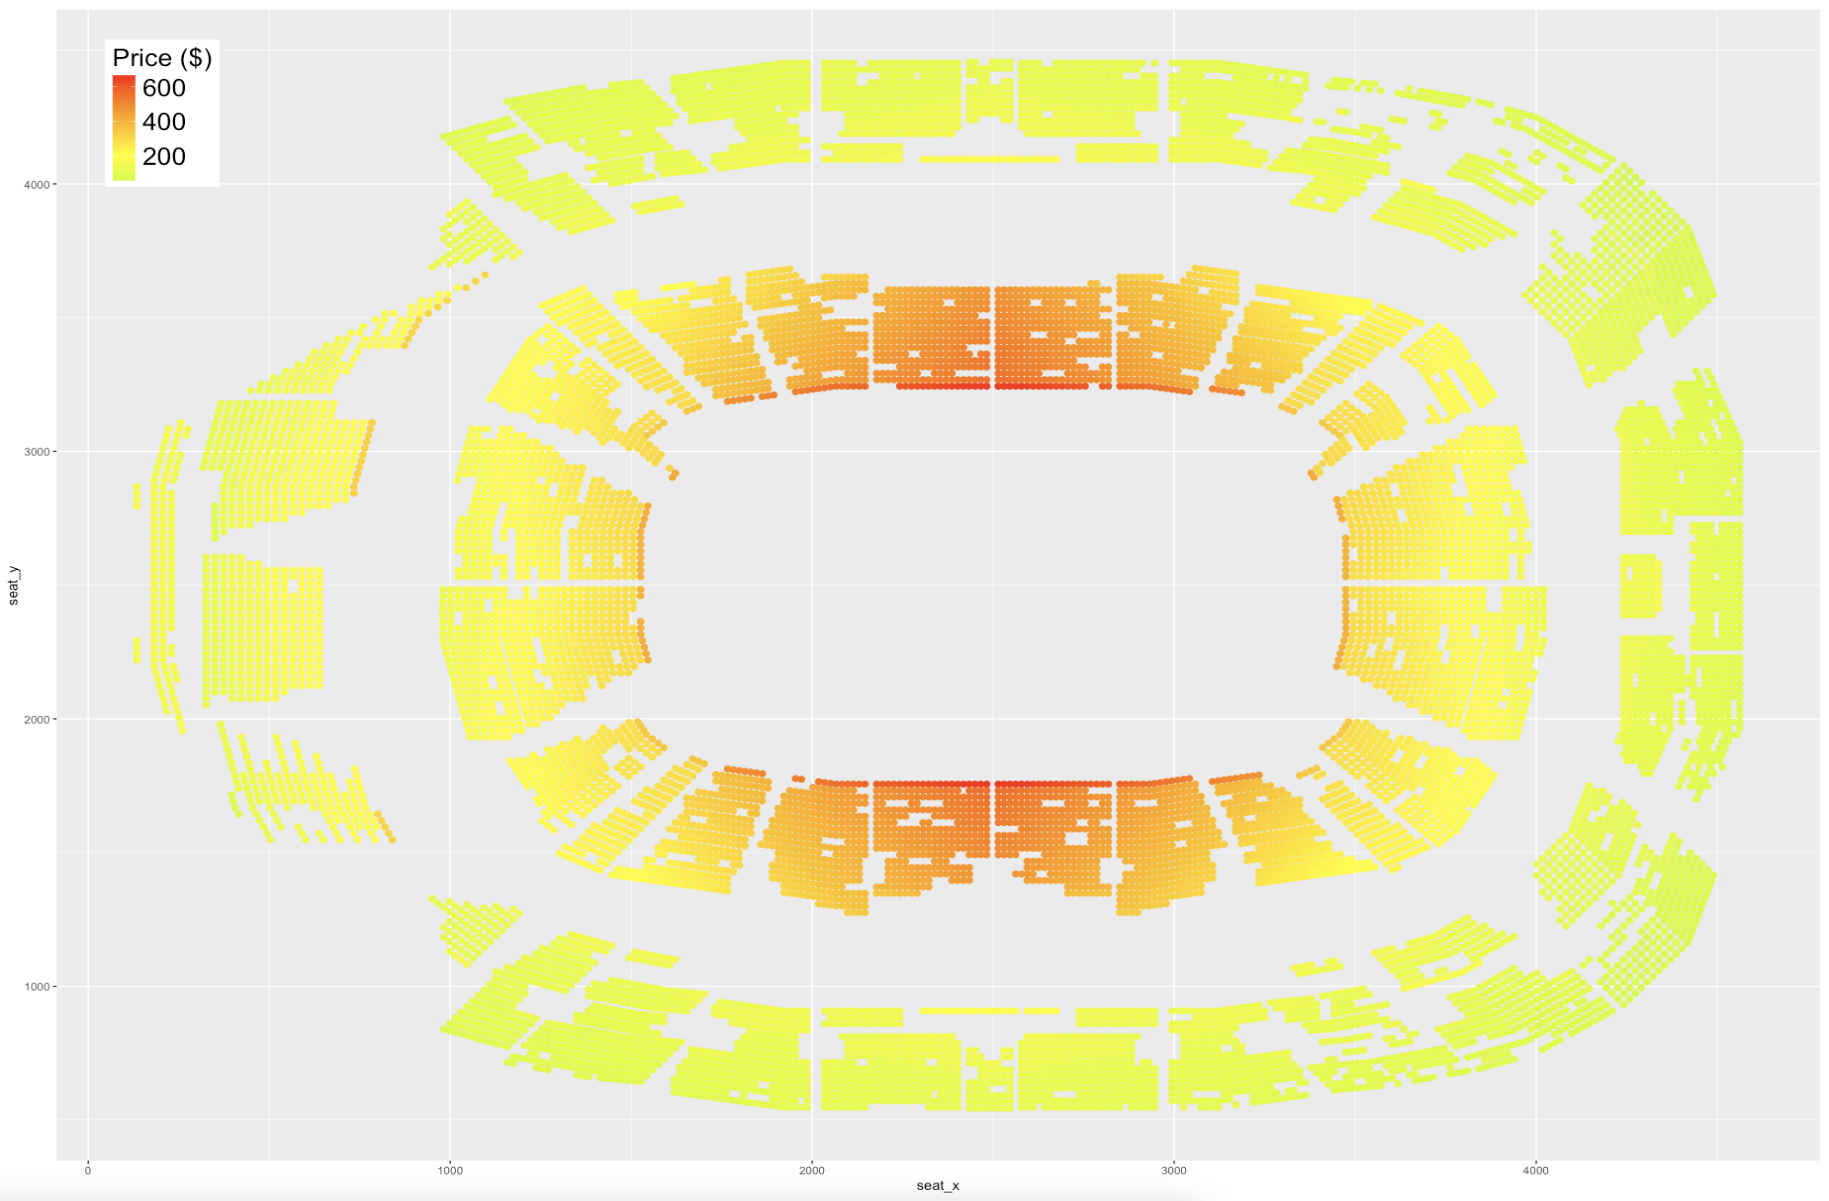
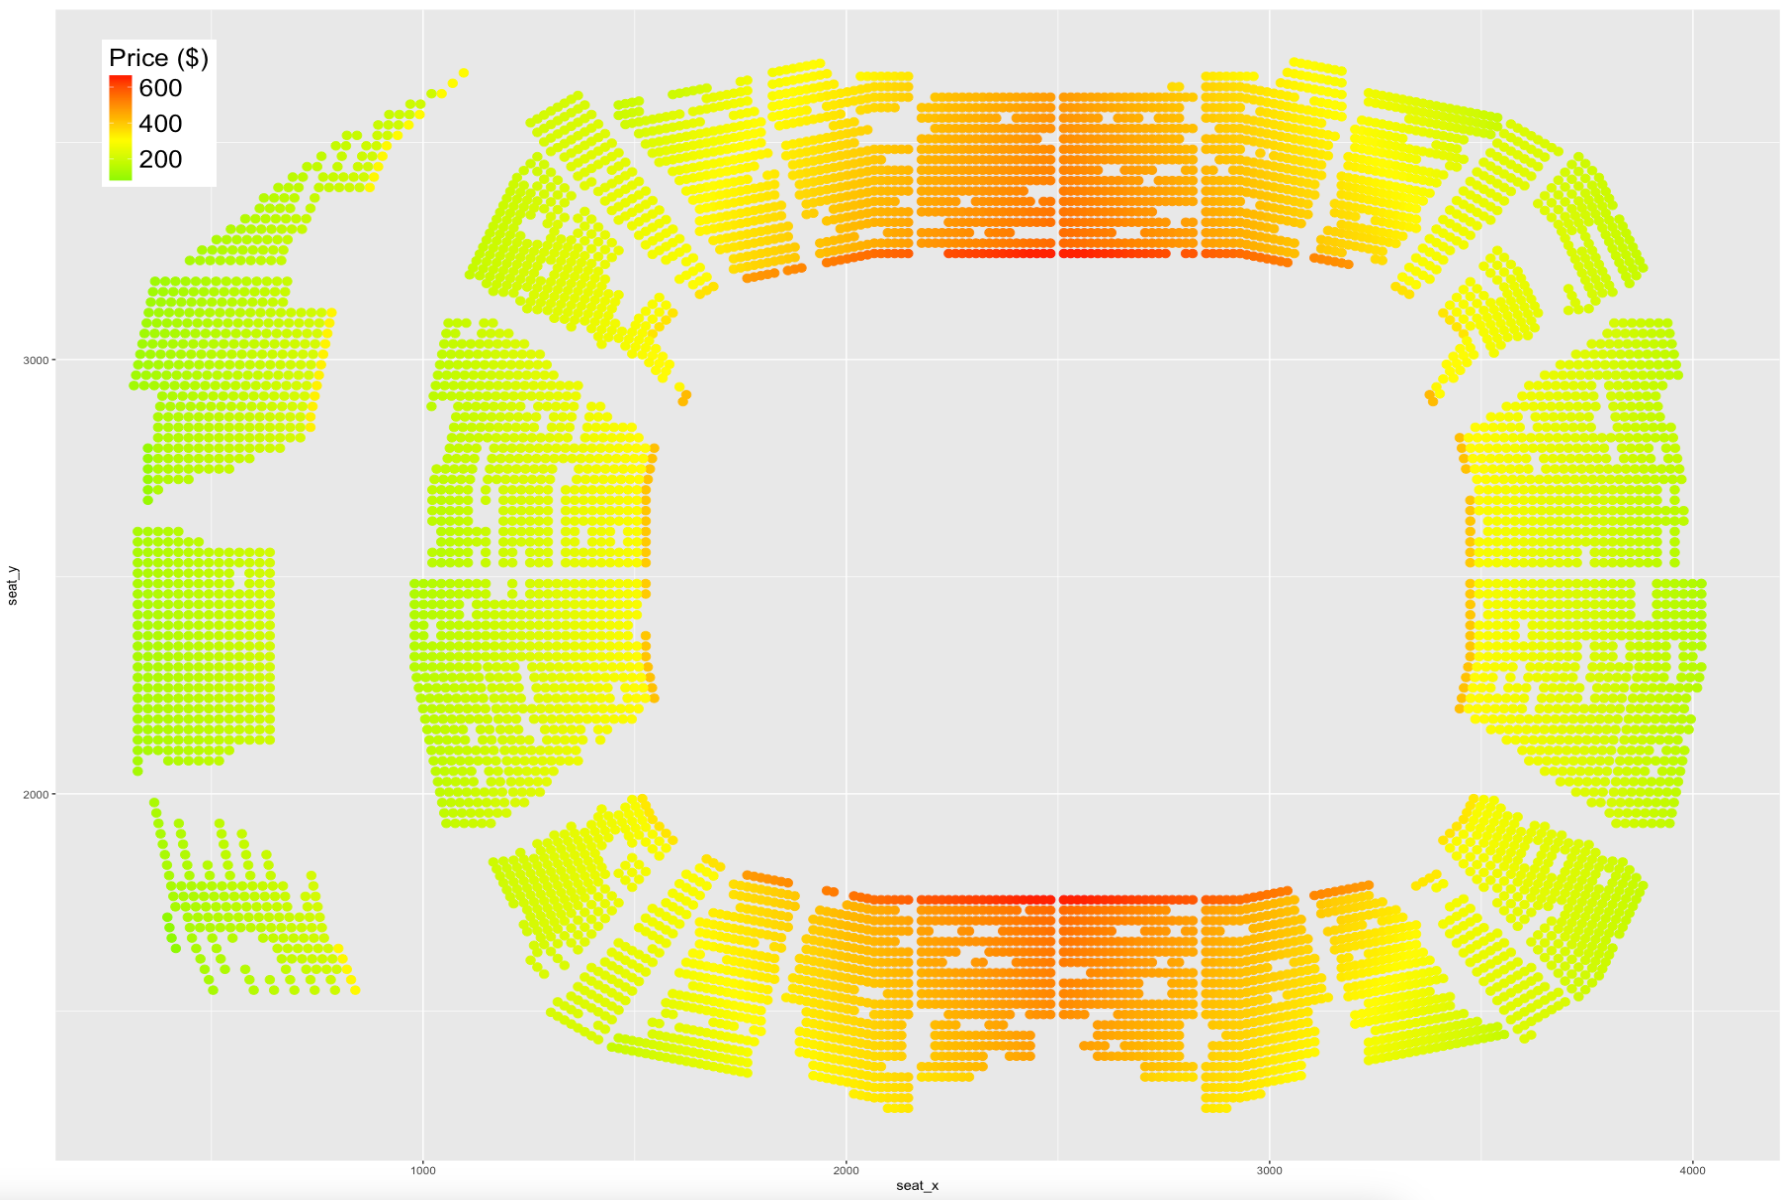
The following graphics showcase the predicted ticket prices for each seat in an individual game:
General Seating: (Most expensive tickets are red)
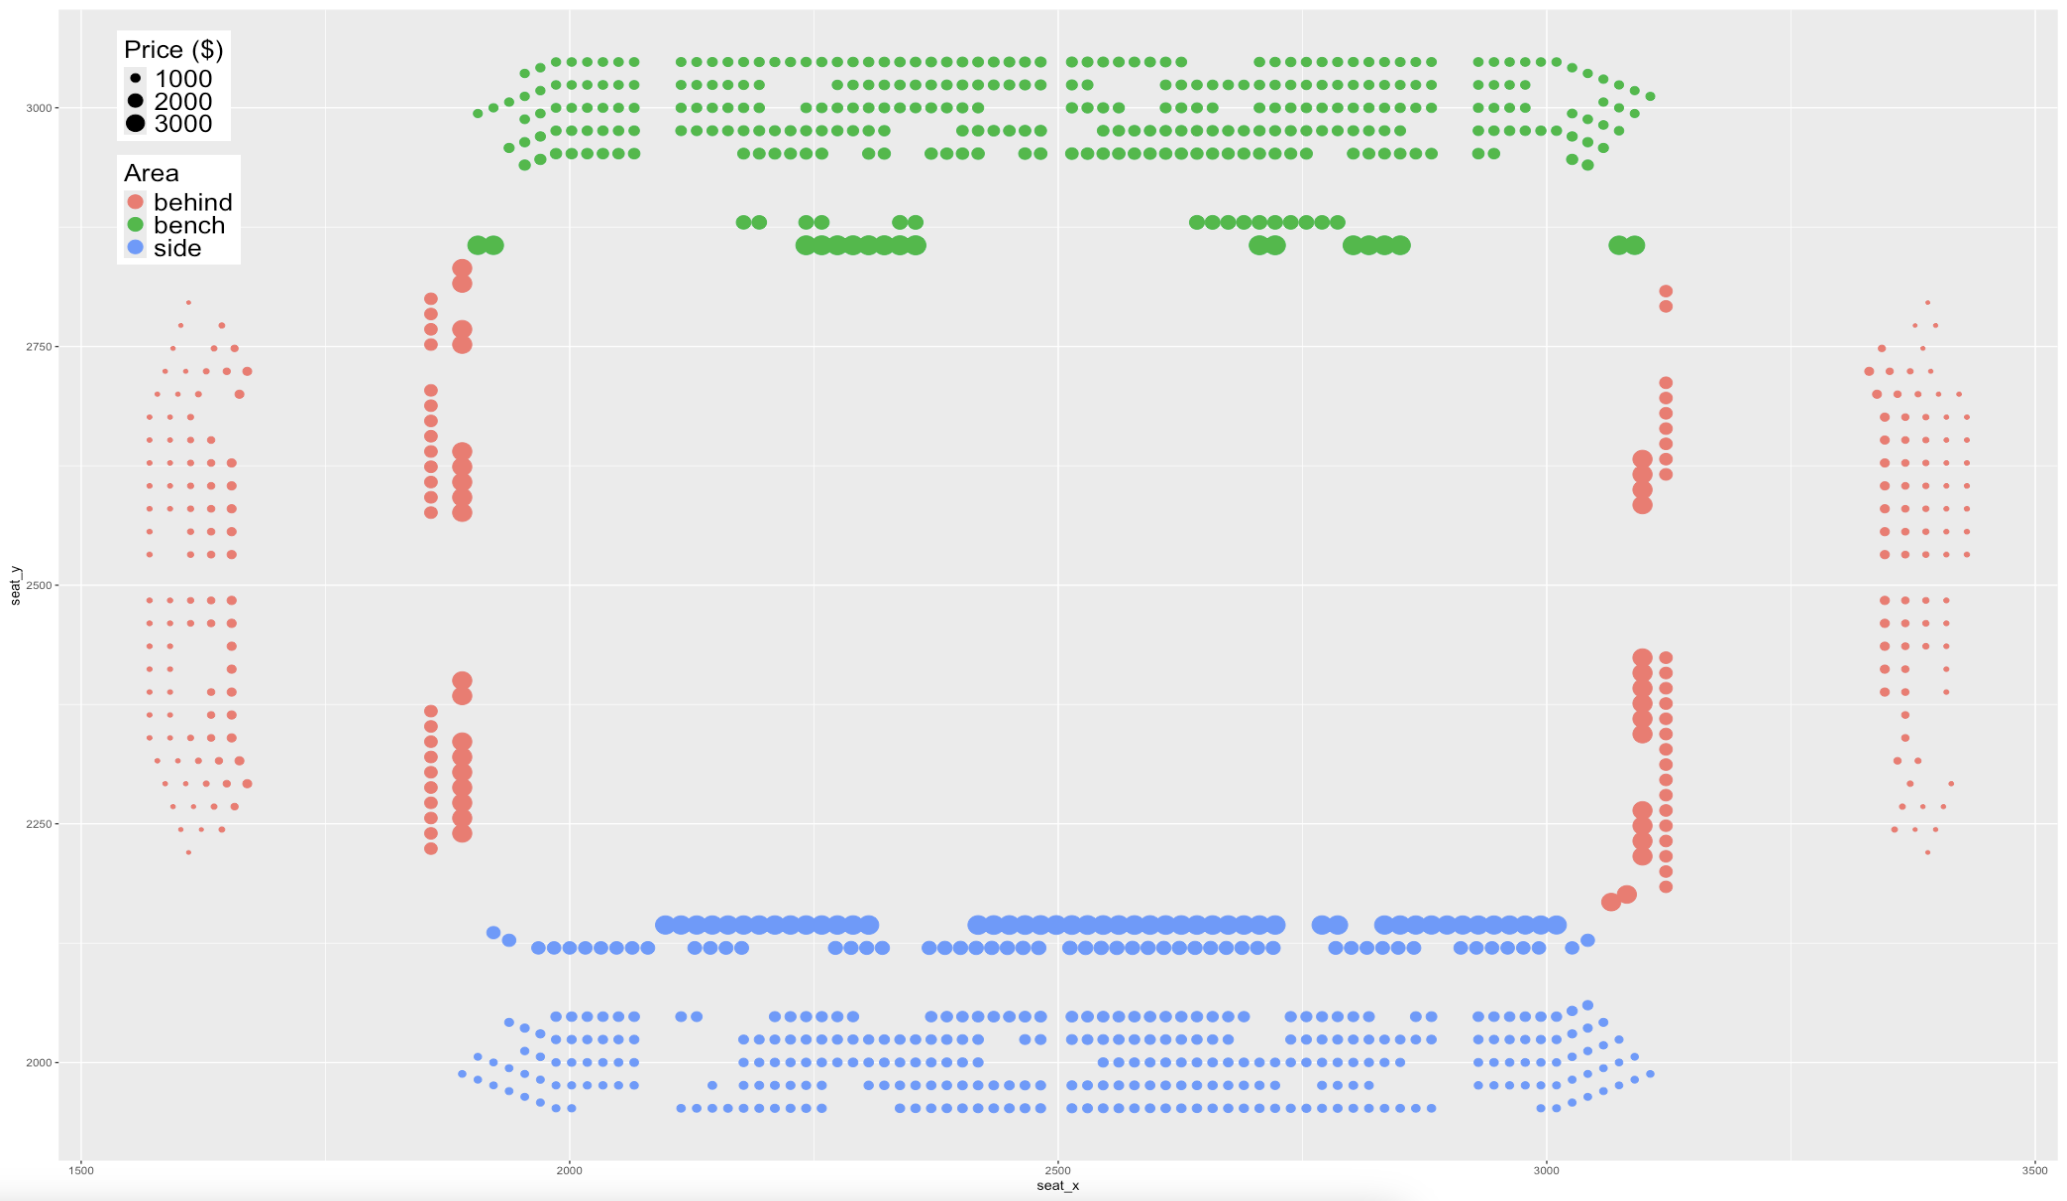
Courtside: (size of seat is predicted price)
Exploratory Analysis
External Game Factors
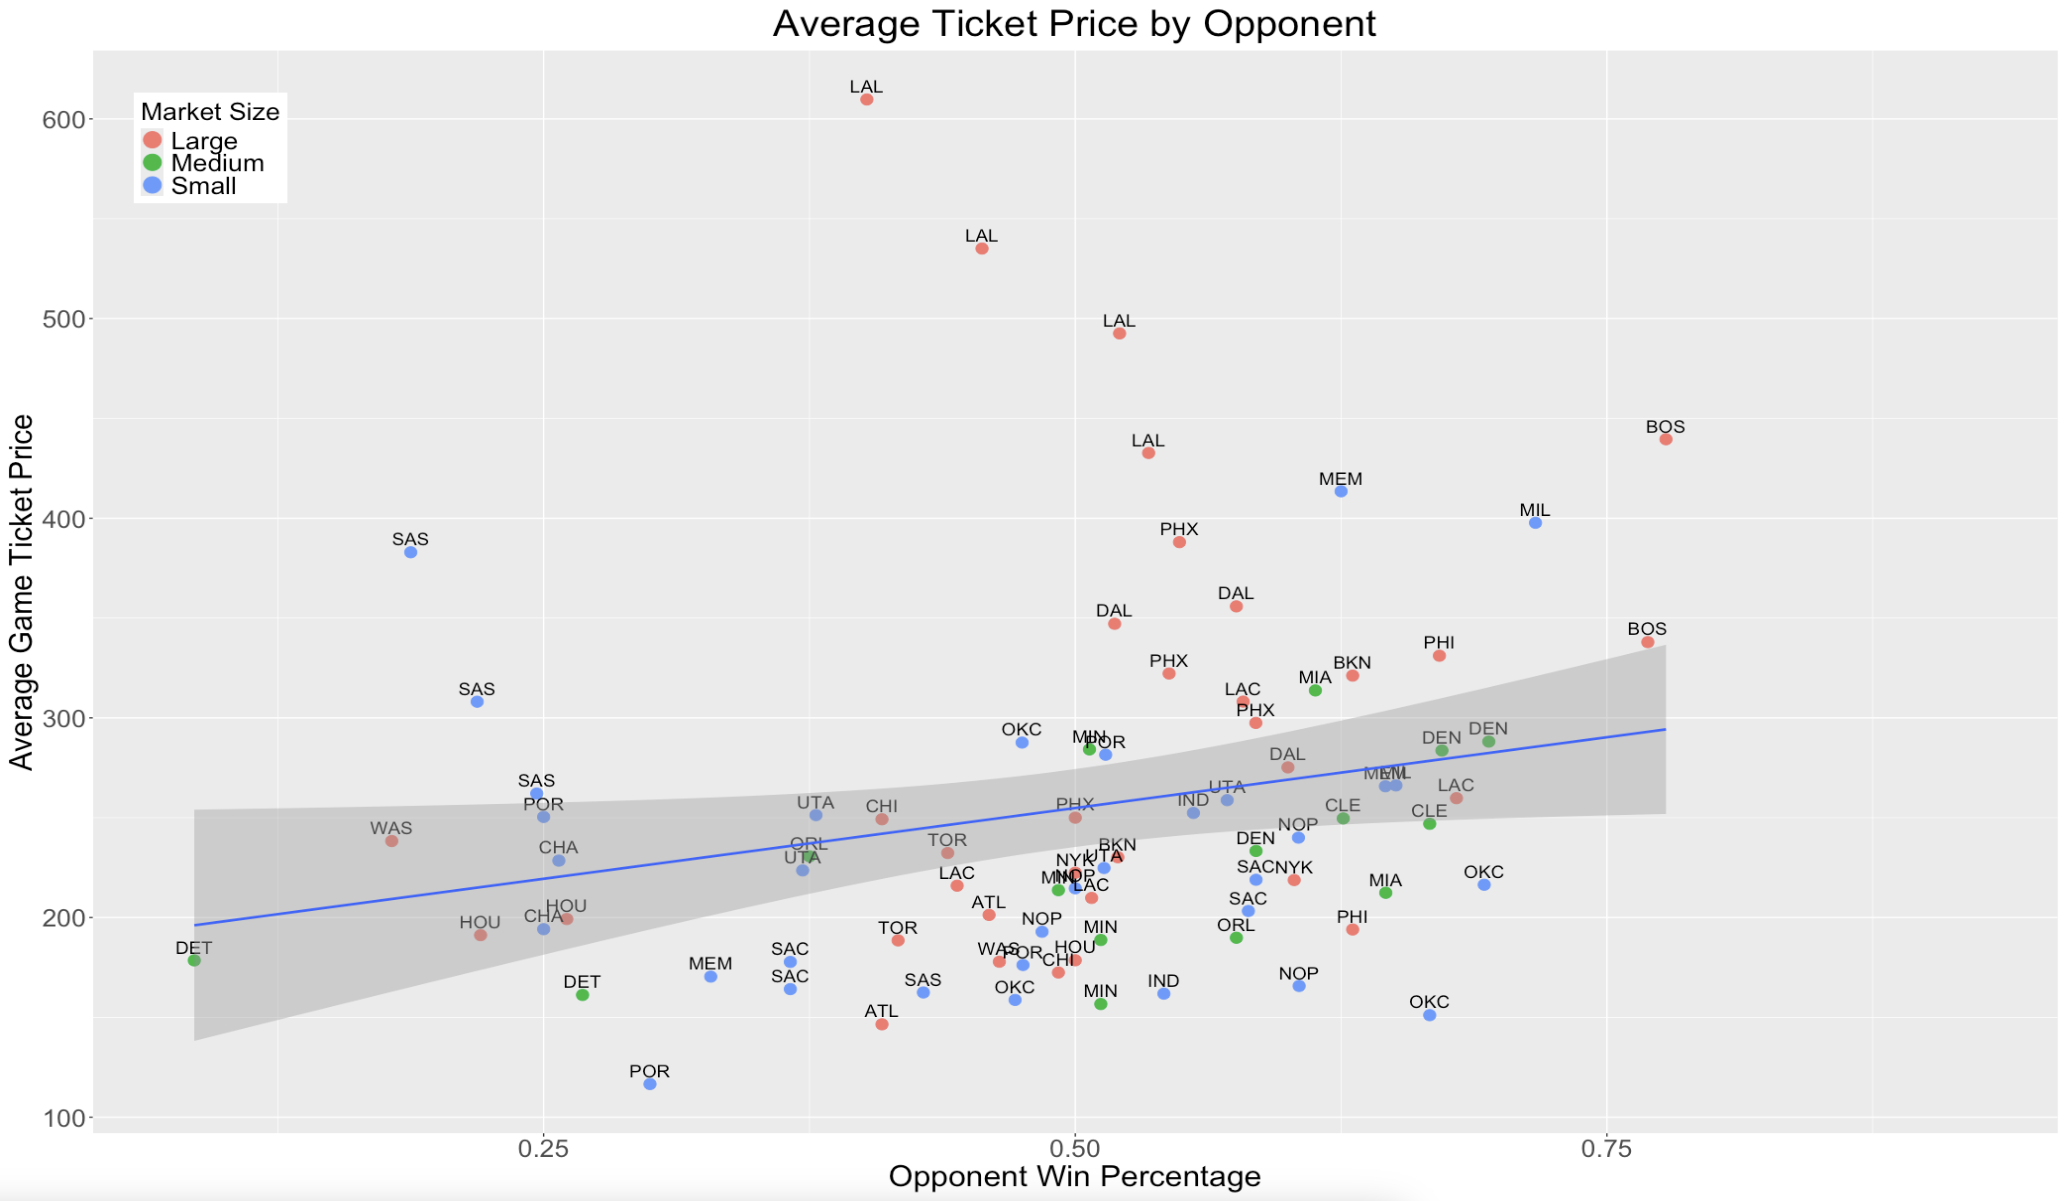
Opponent:
Playing big market teams and opponents that win more both lead to higher average ticket prices:
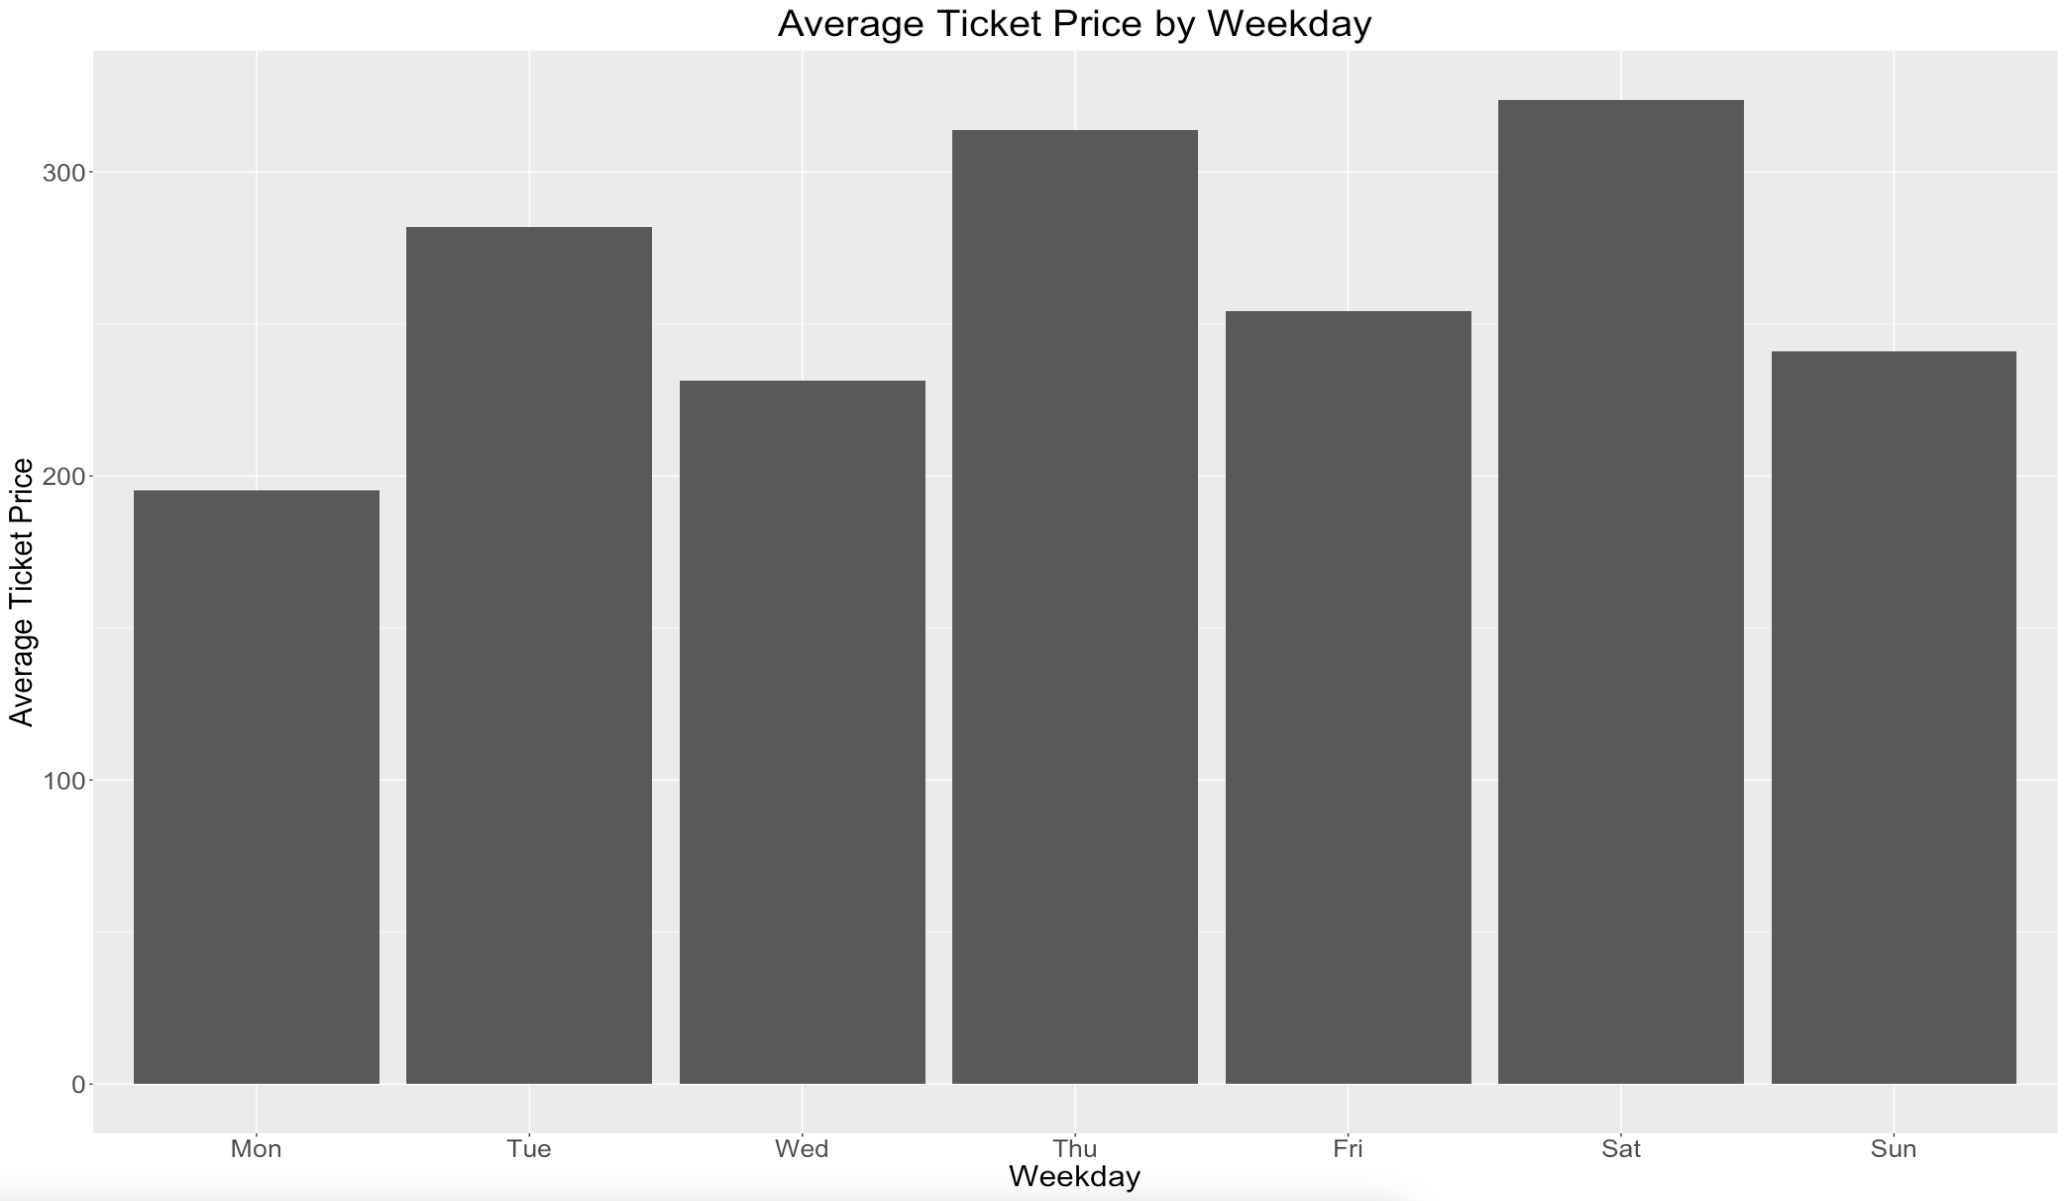
Weekday:
Saturday games have the highest prices on average, but there are no other clear trends here:
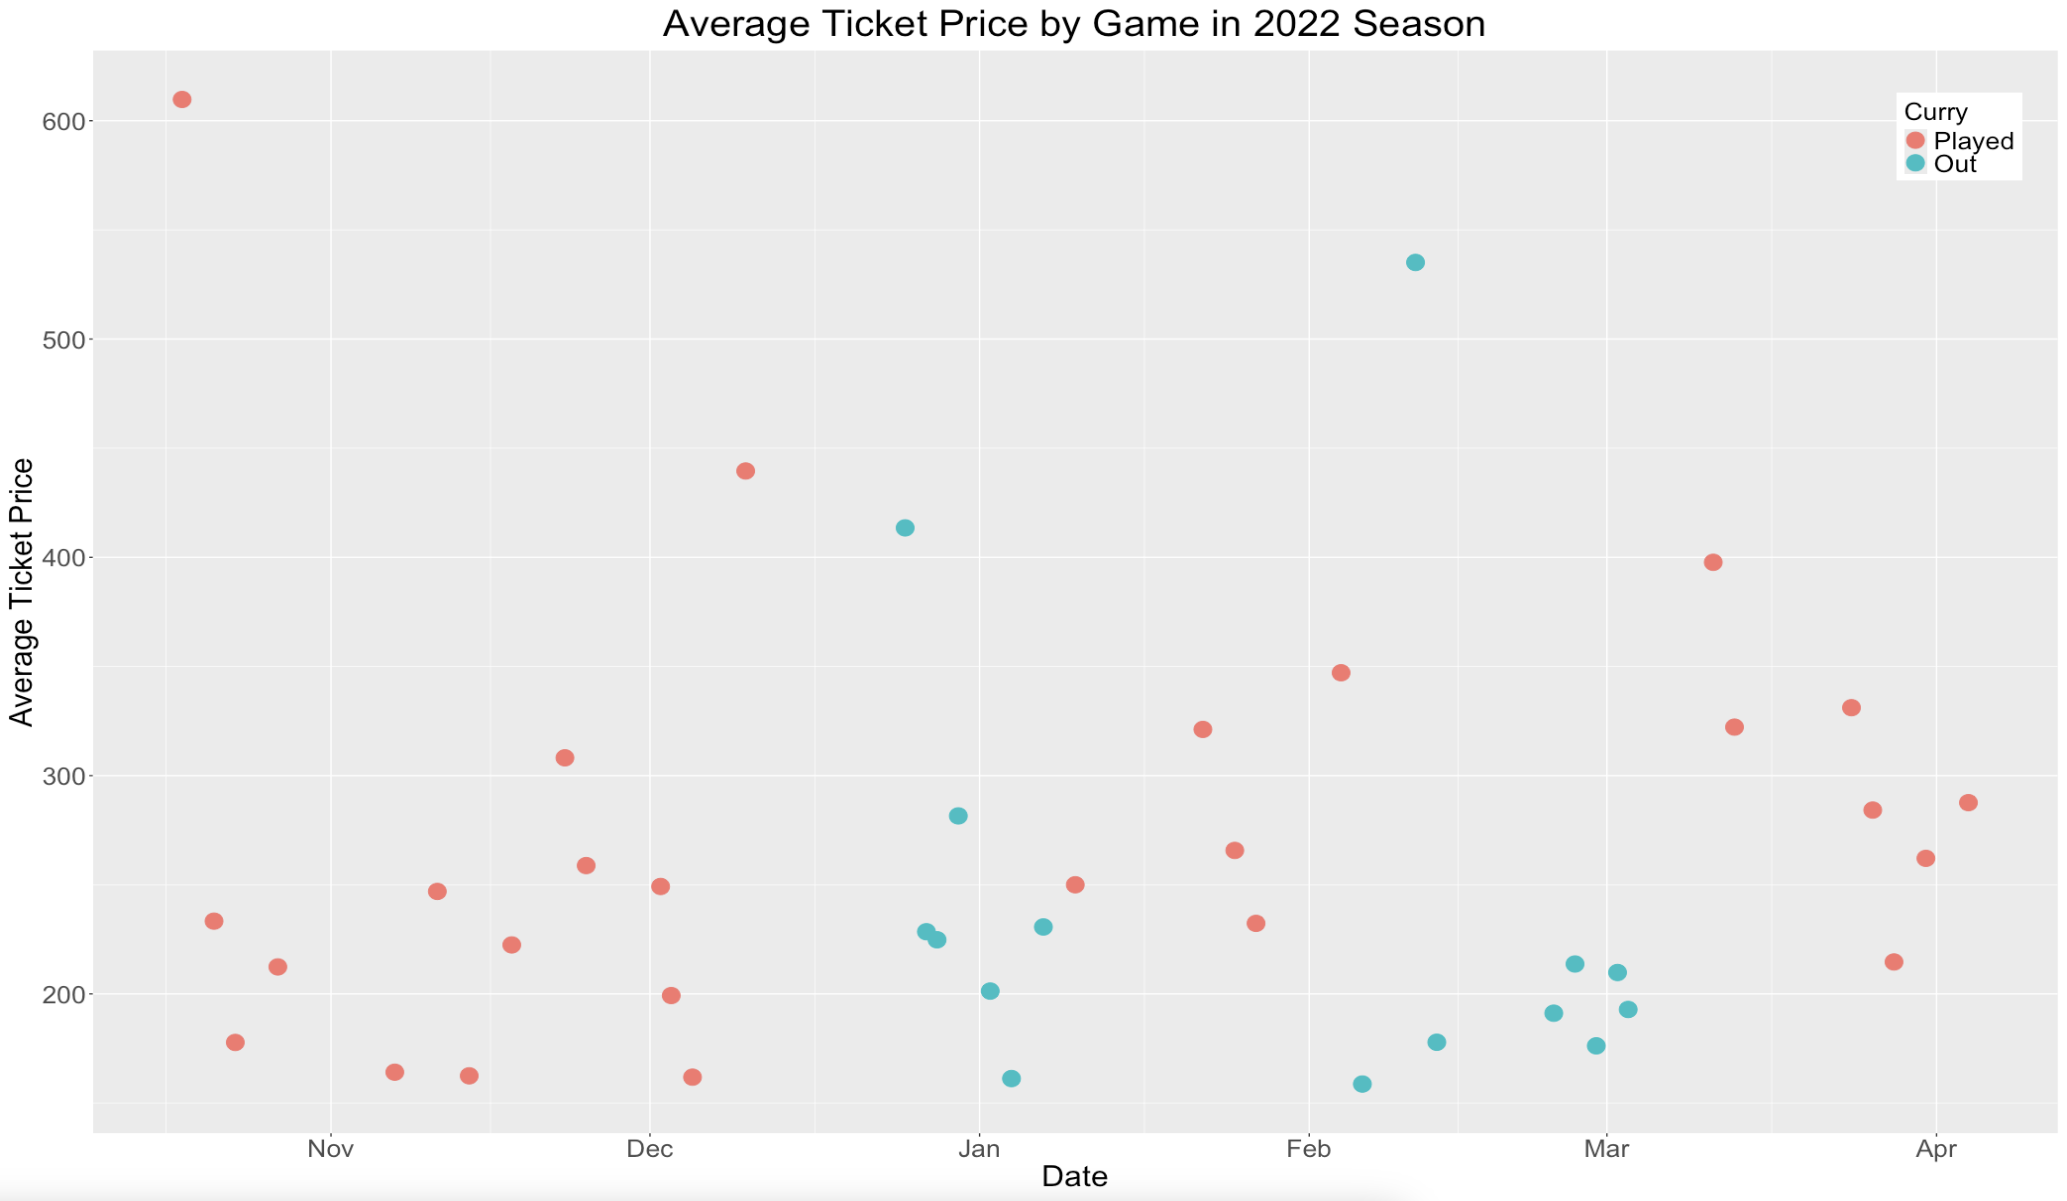
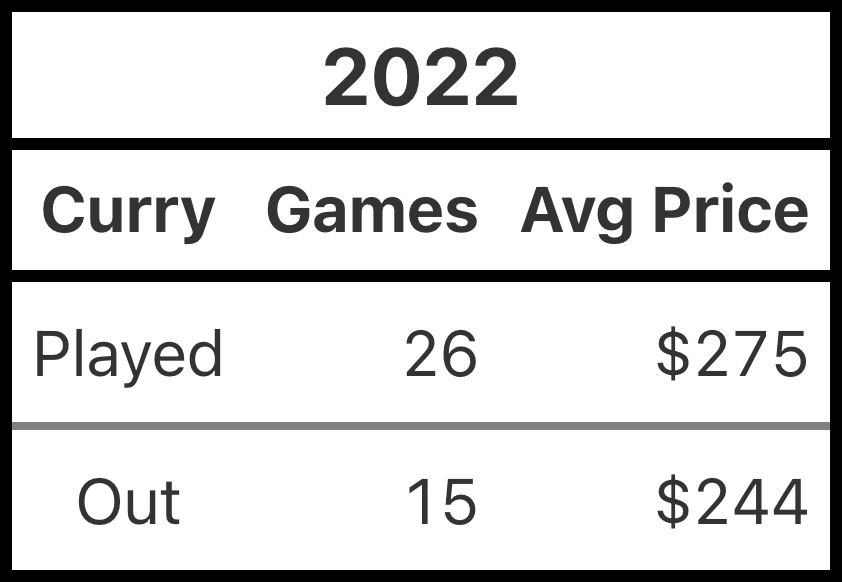
Star Player Impact:
Steph Curry missed 15 games in 2022, and the average ticket prices dropped when he was out:
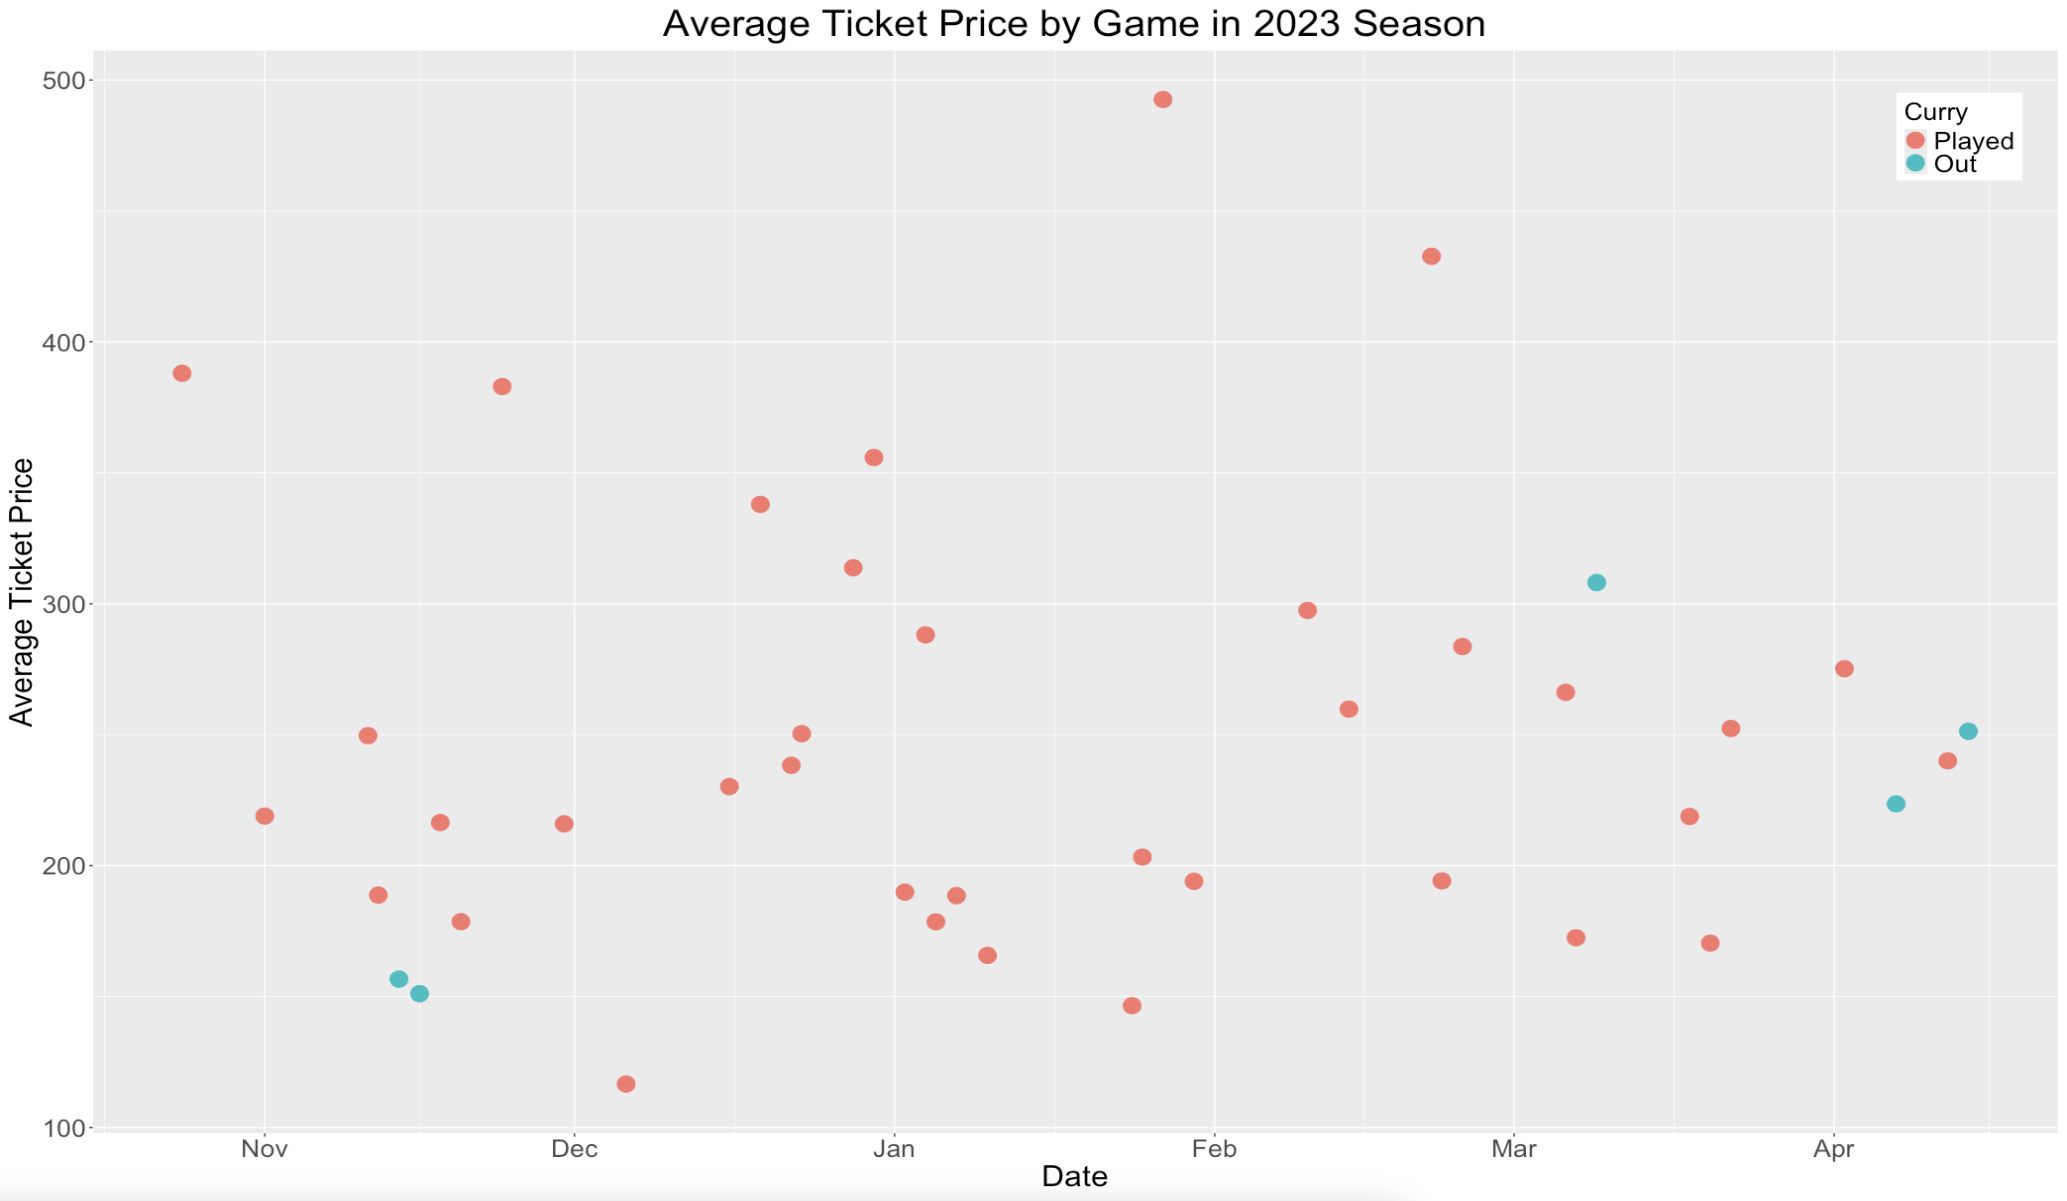
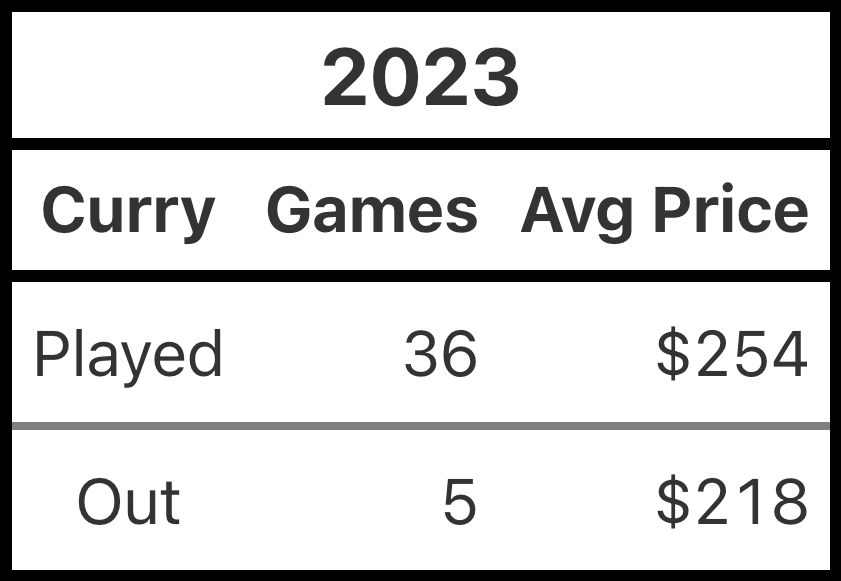
He did not miss as many games in 2023, but again these games had lower prices:
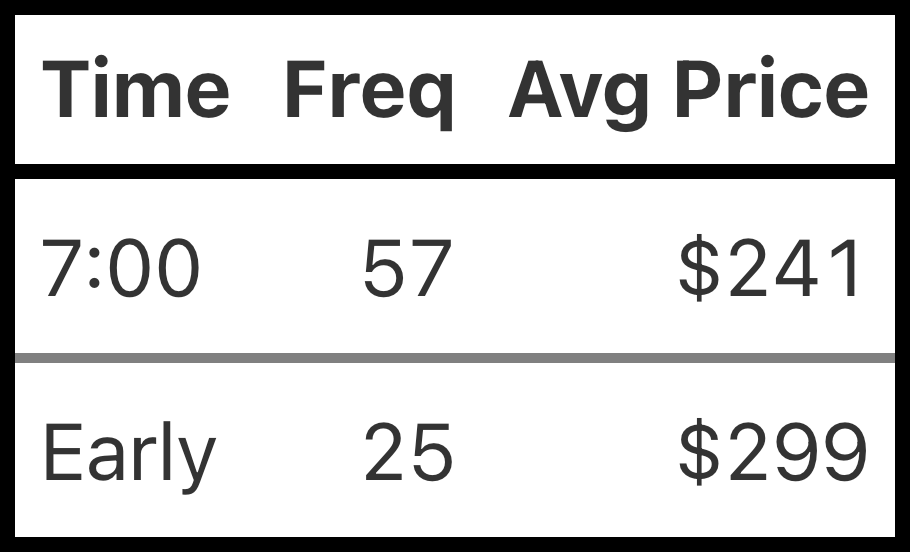
Gametime:
Most games were played at 7:00 local time. 25 games were played earlier (almost all at 5:30), and the earlier games had lower average ticket prices:
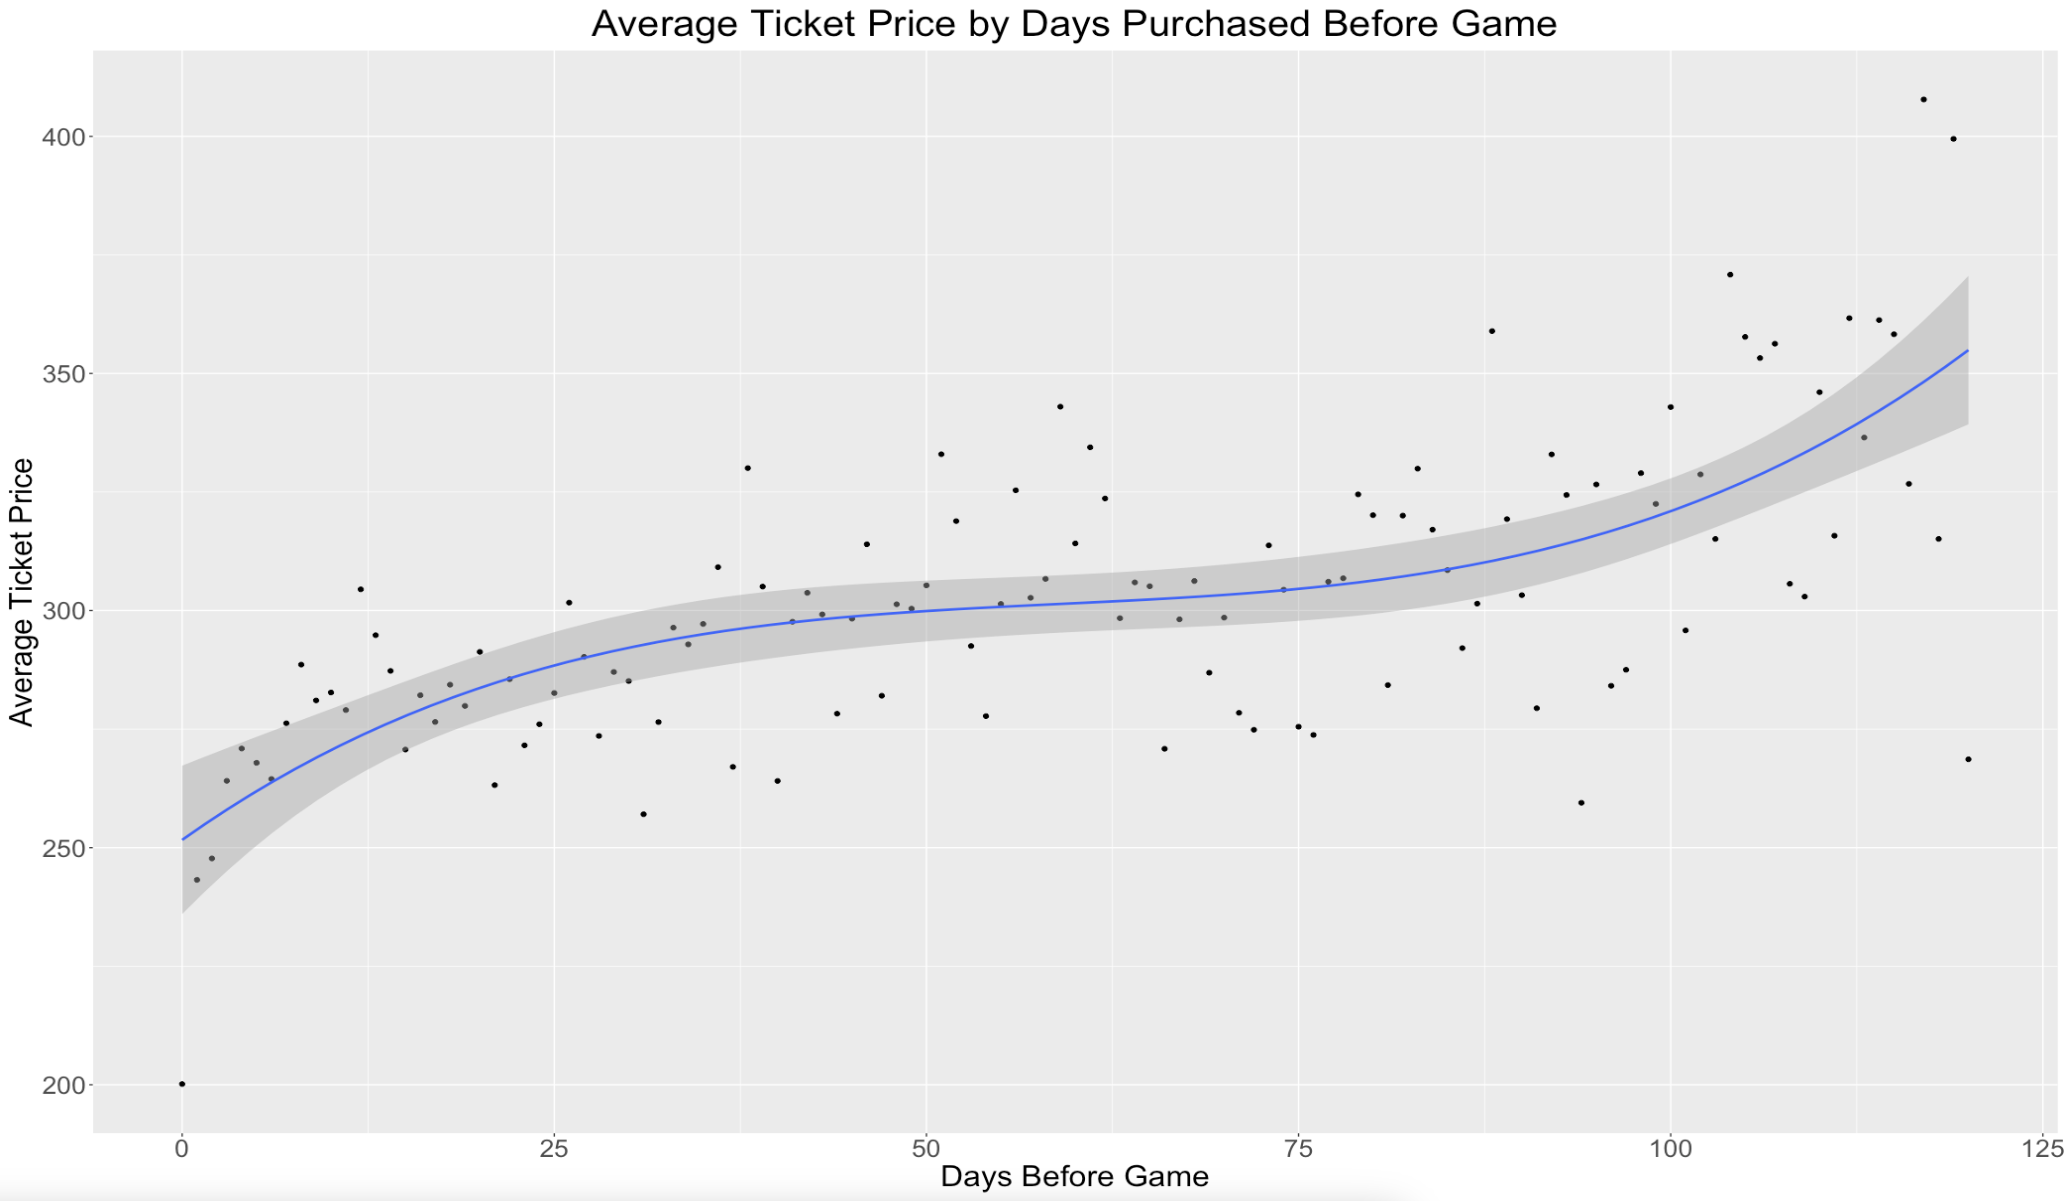
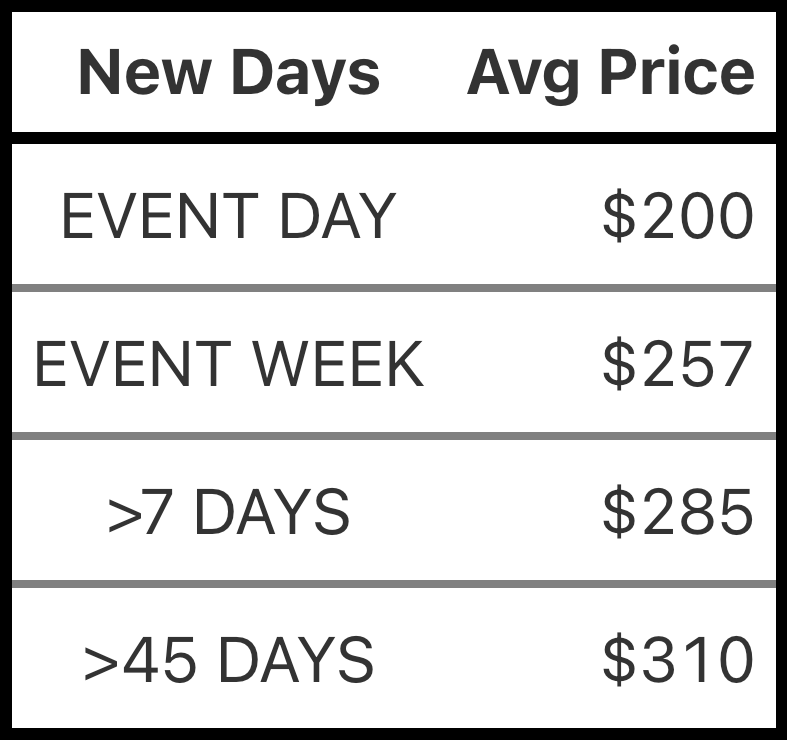
Time of Purchase:
Tickets are more expensive when purchased further out from games. There was a sharp decrease in the price of gameday tickets:
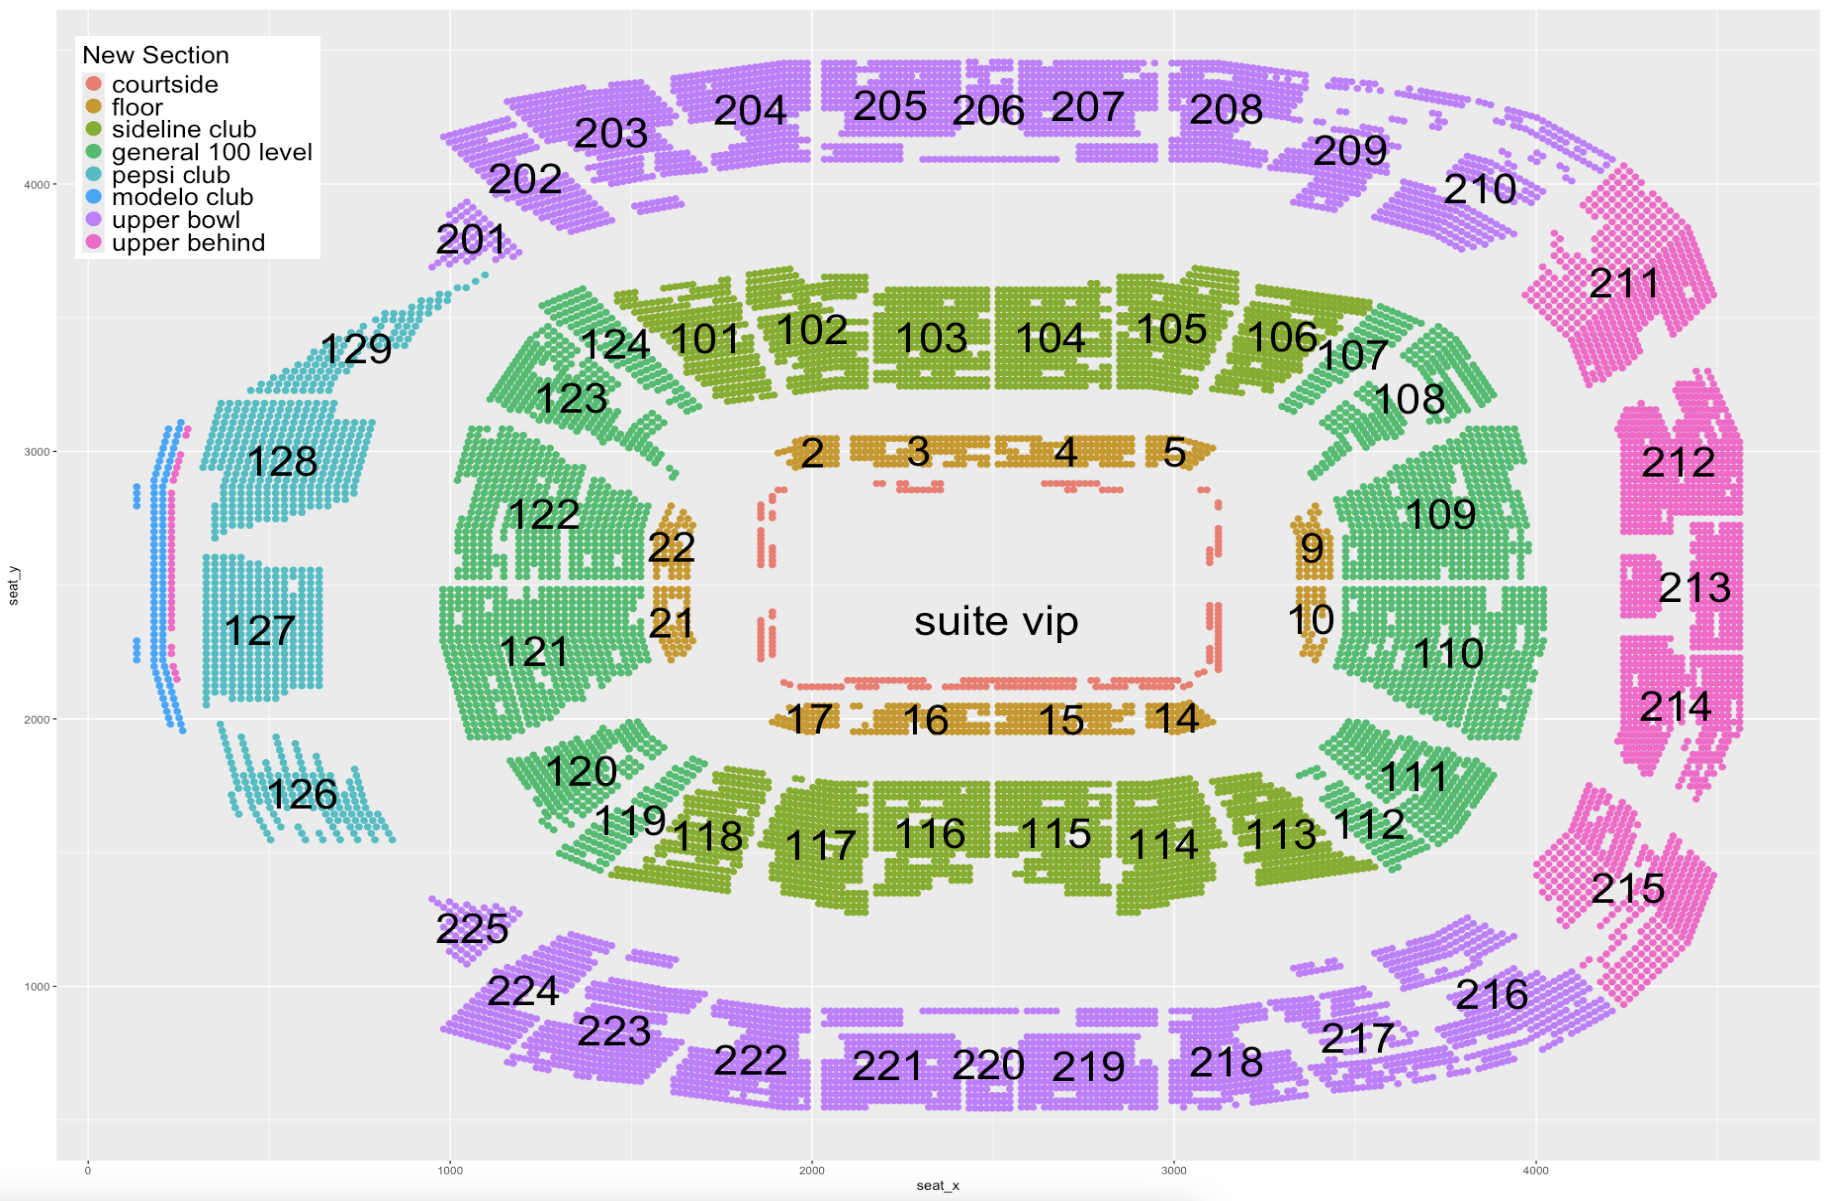
Stadium Areas
The following sections were deduced with the data provided:
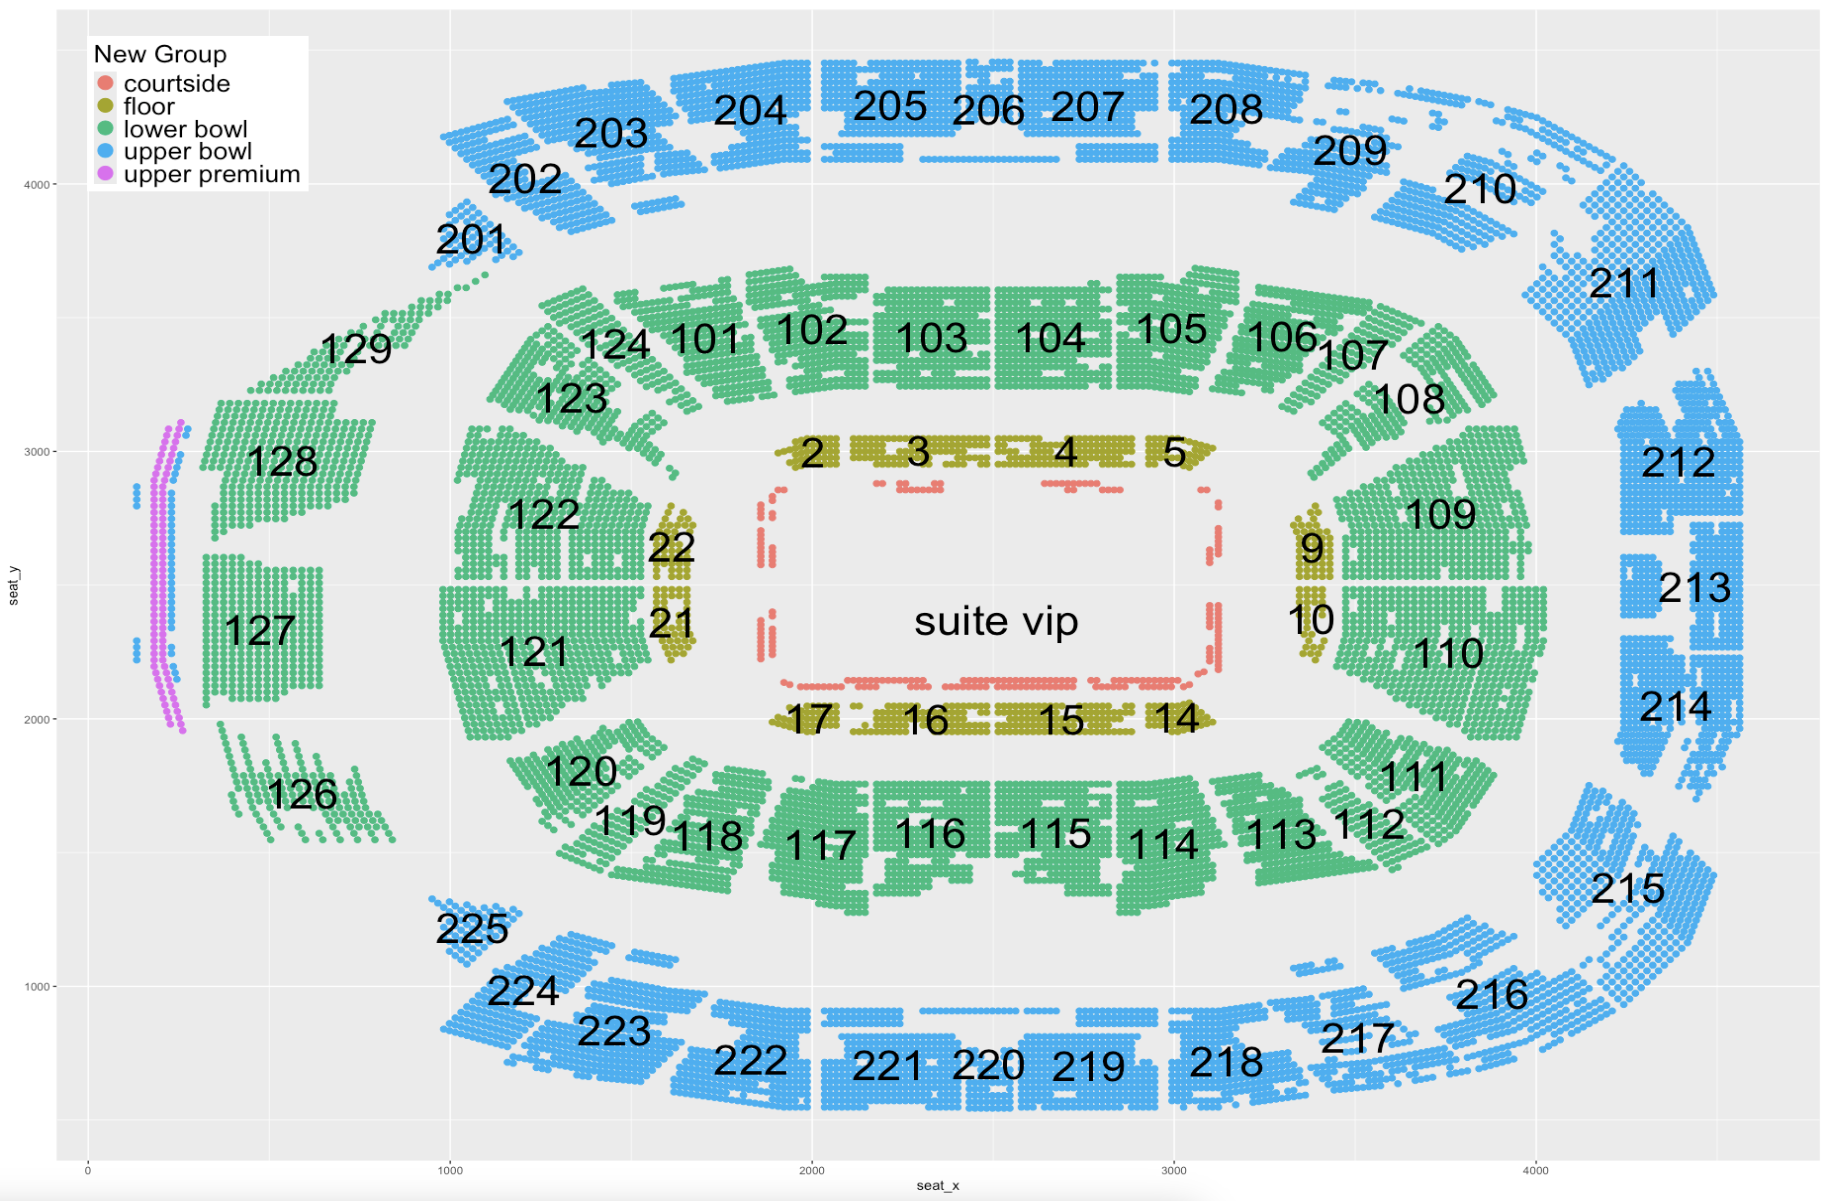
Bowl:
The bowl of the arena was broken down into further sections based on location and club access:
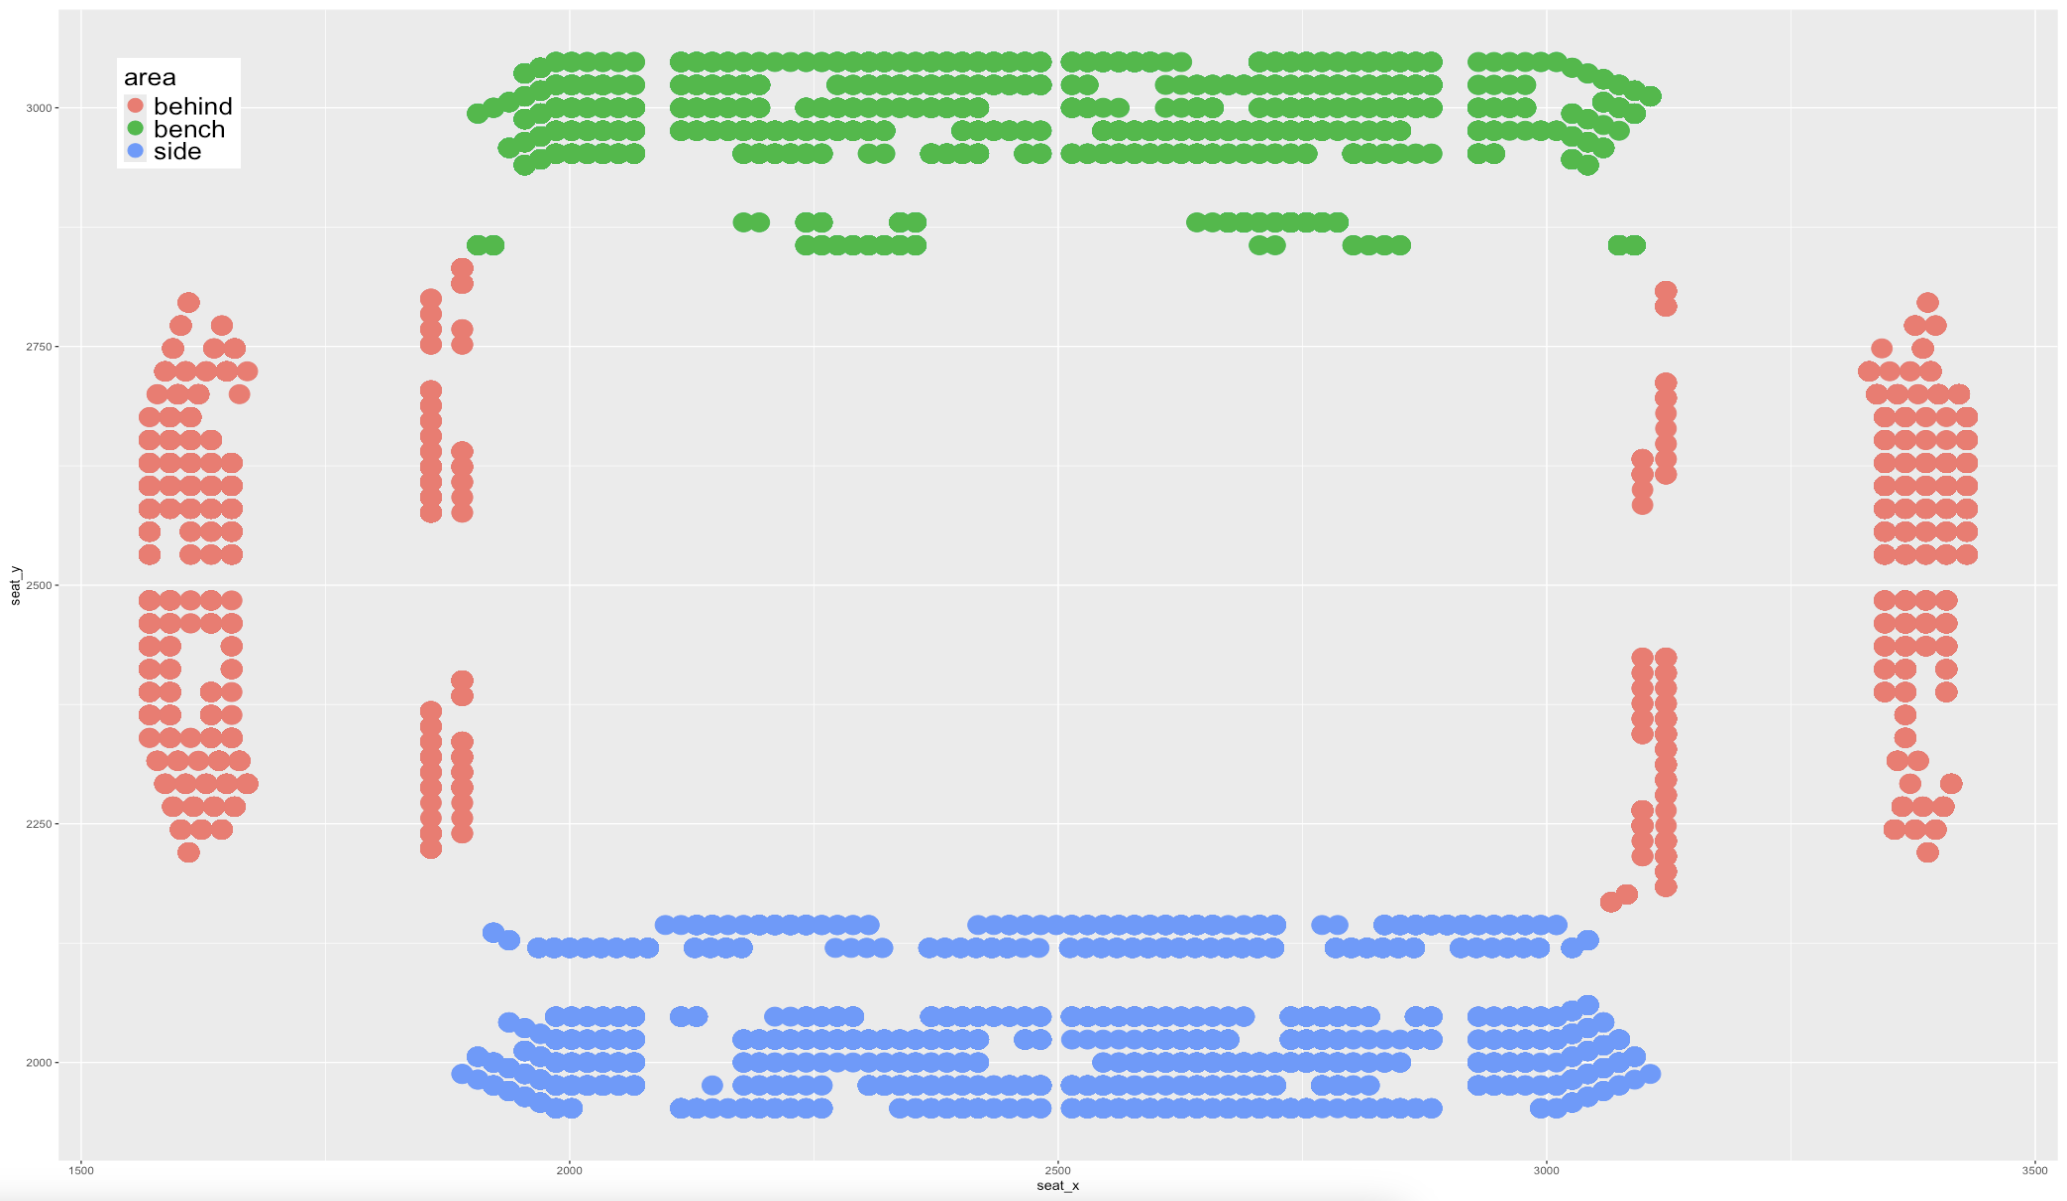
Courtside & Floor:
The floor was split up by side of the court:
Seat Features
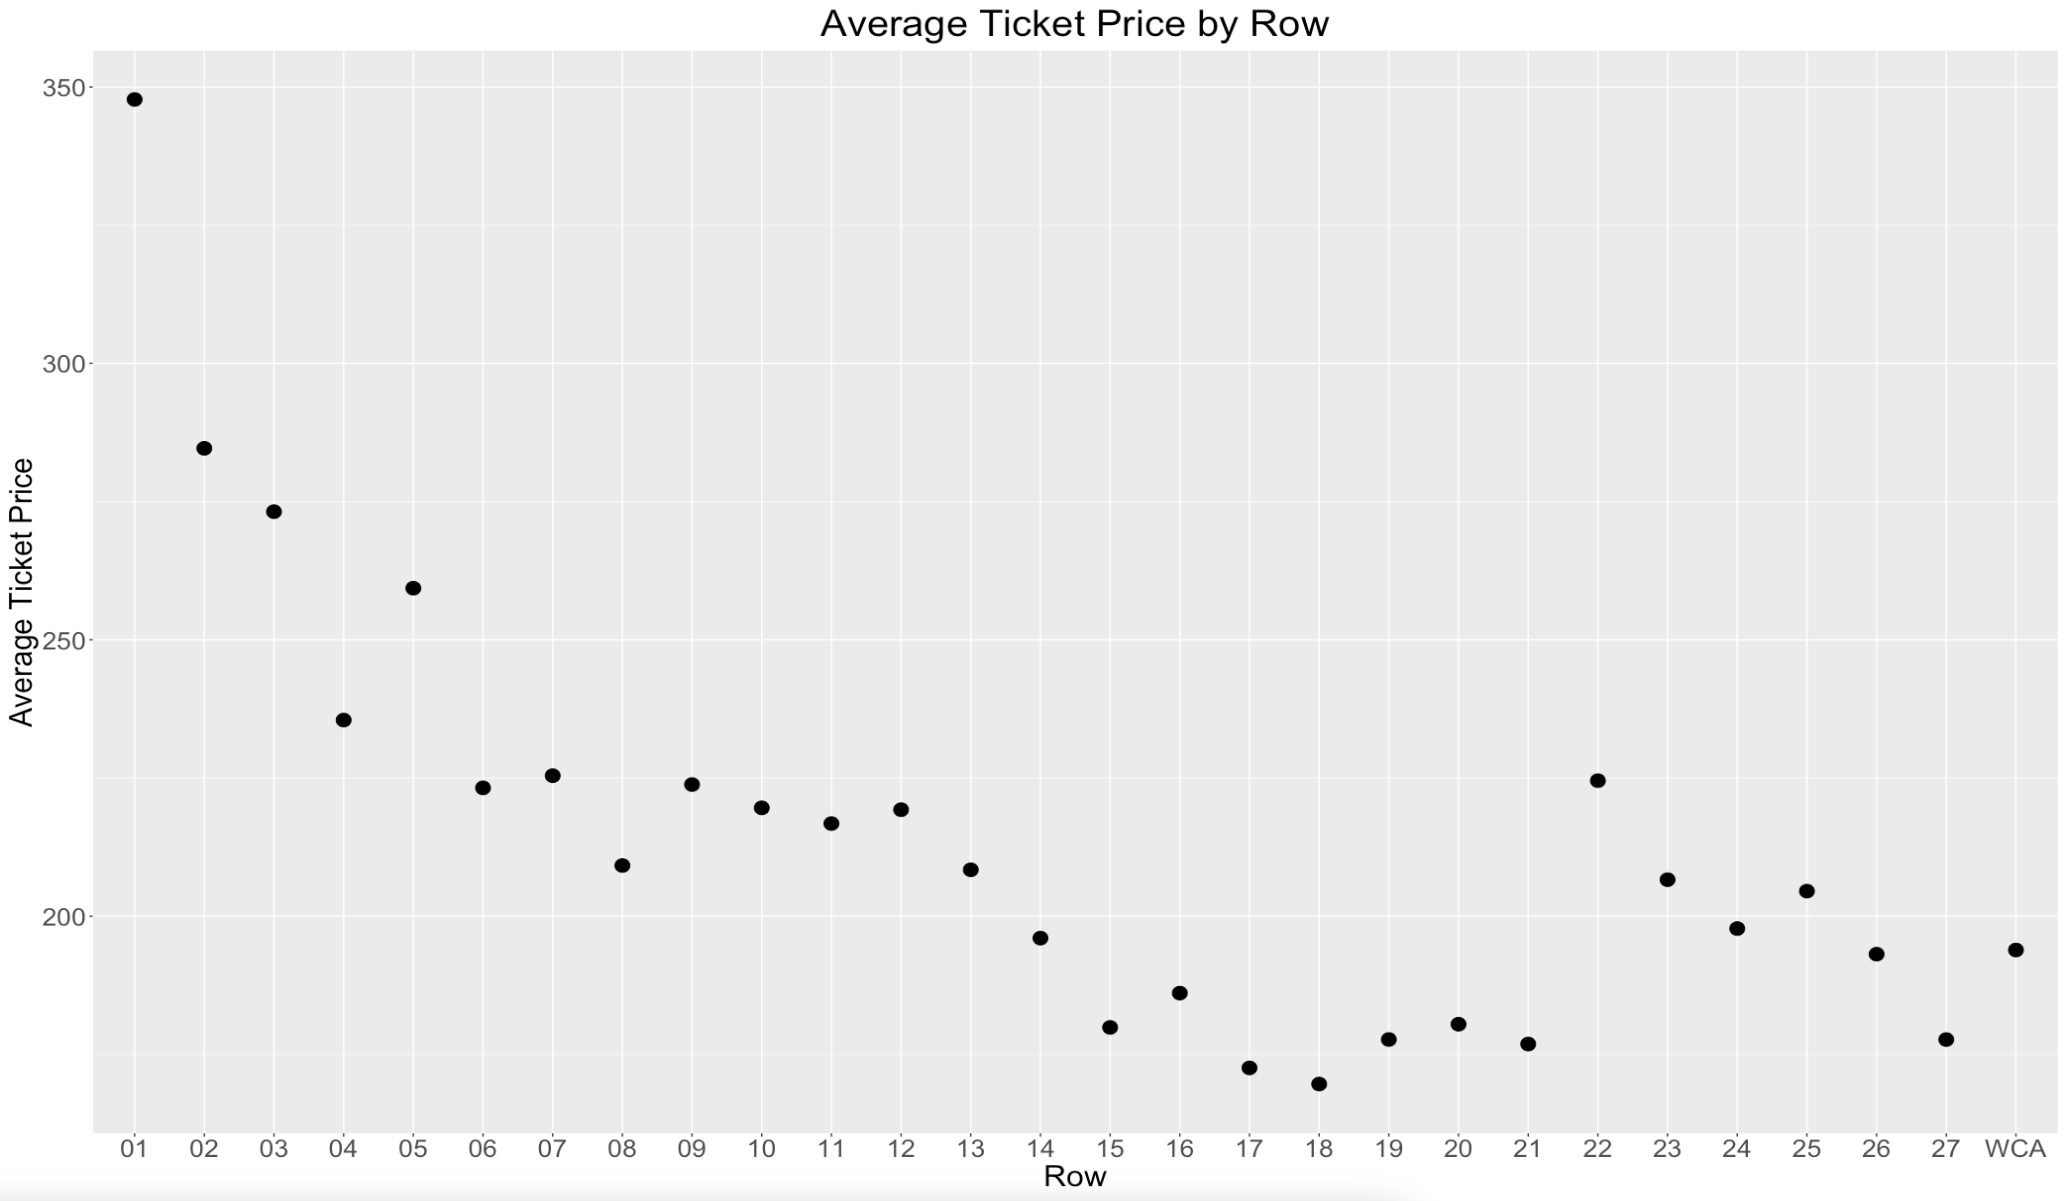
Row:
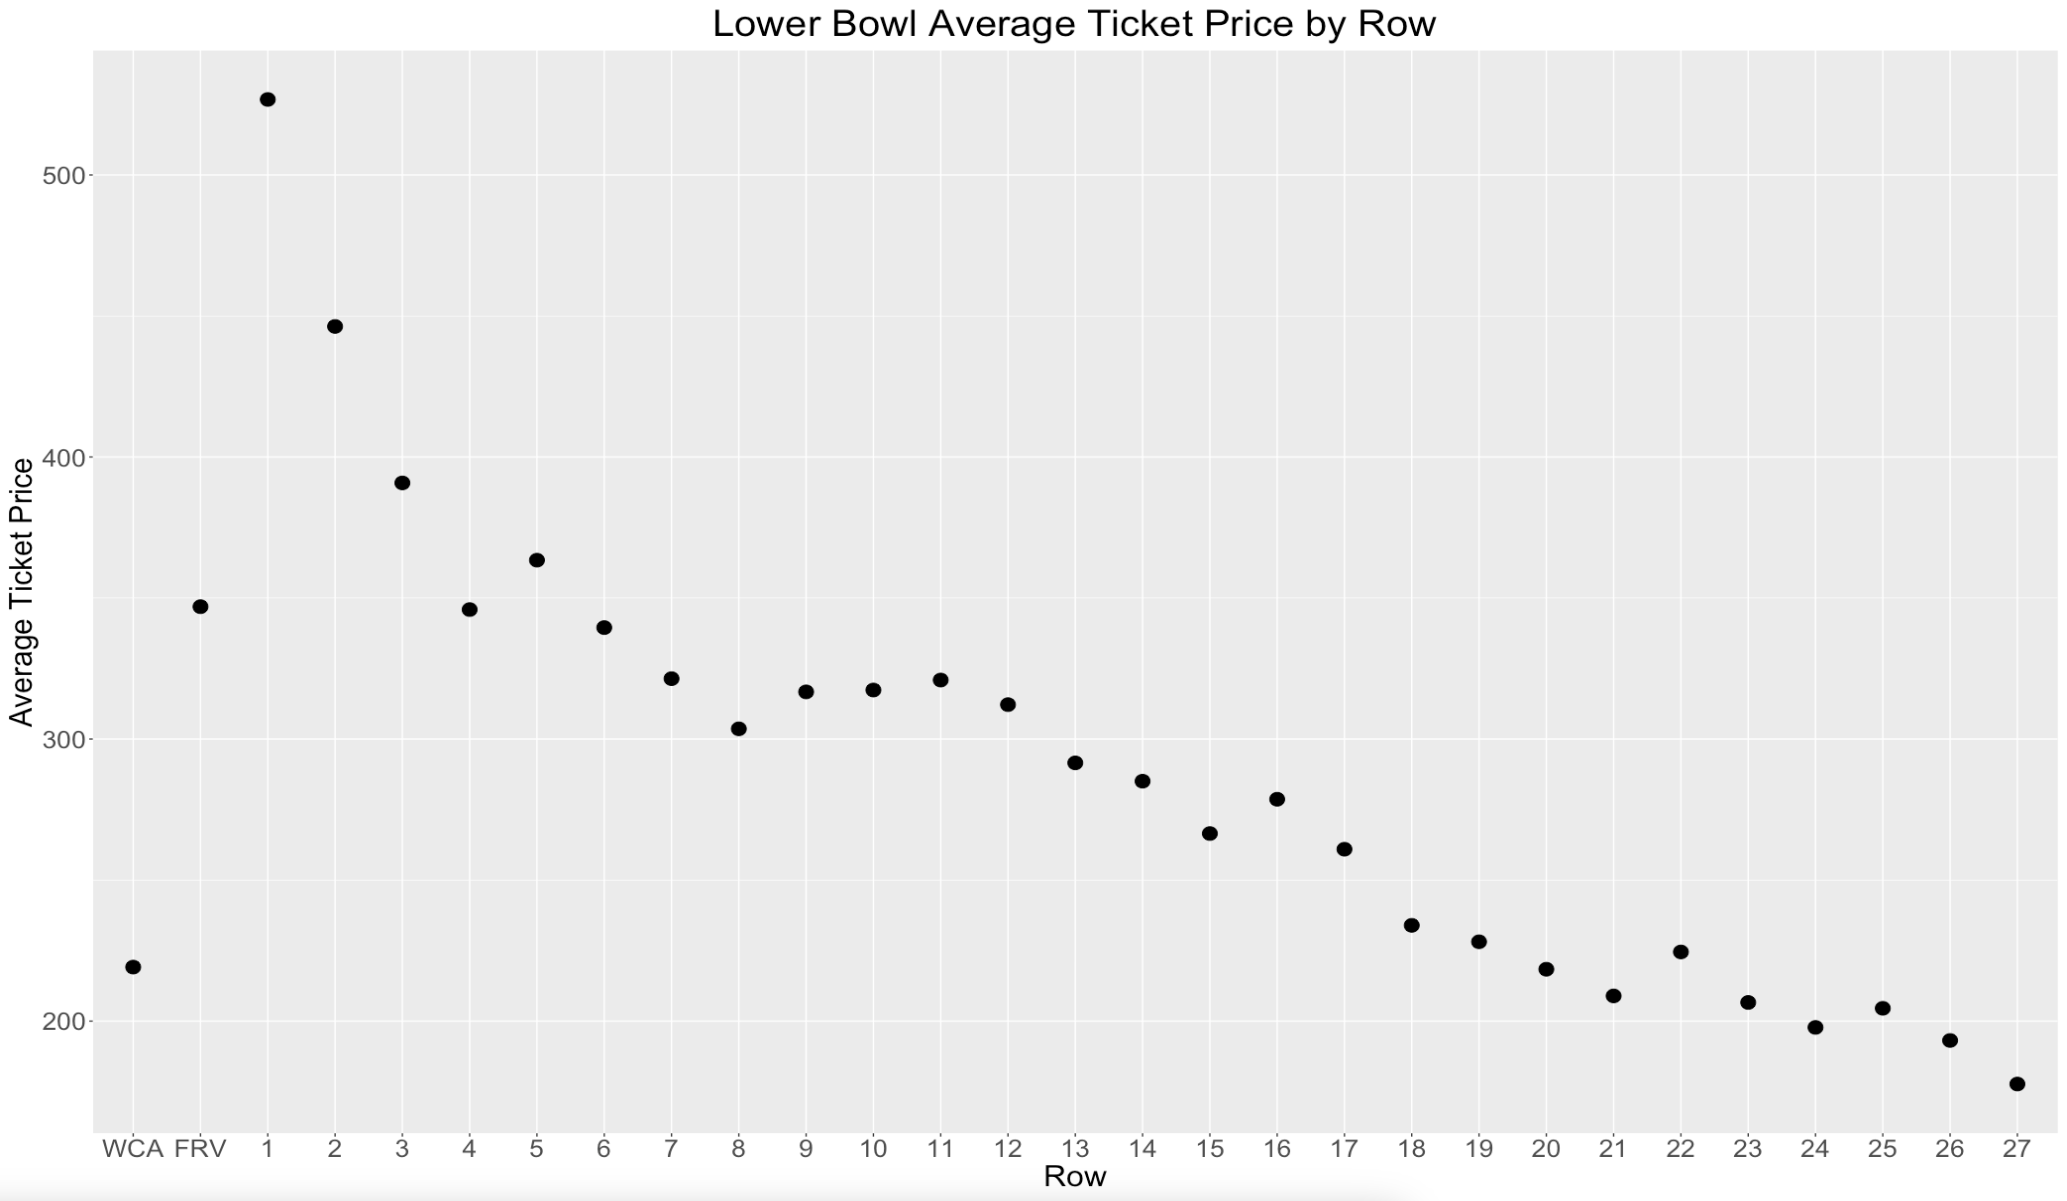
As expected, the average ticket price decreases as you go back in rows:
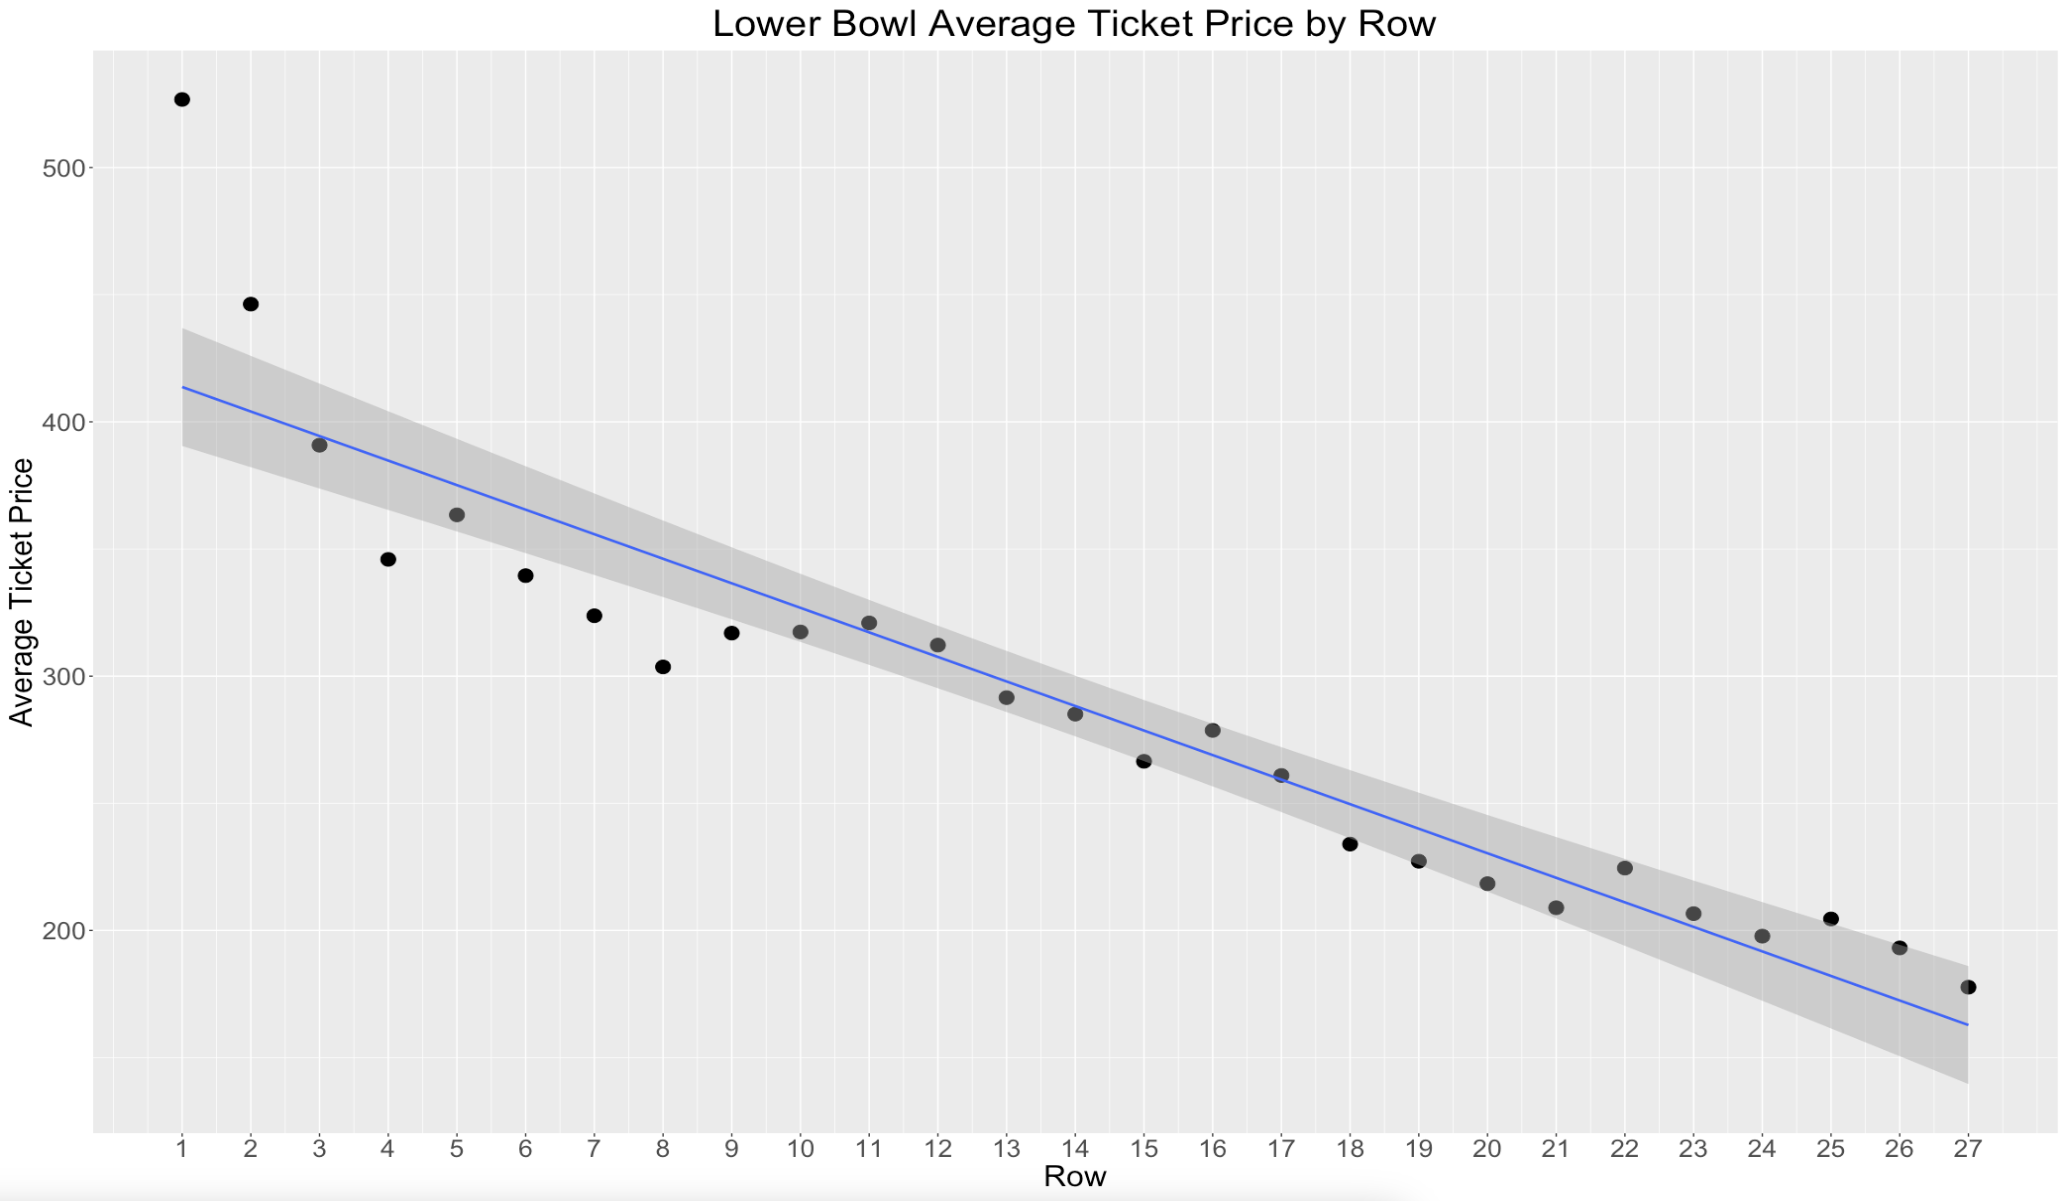
This is especially true in the lower bowl:
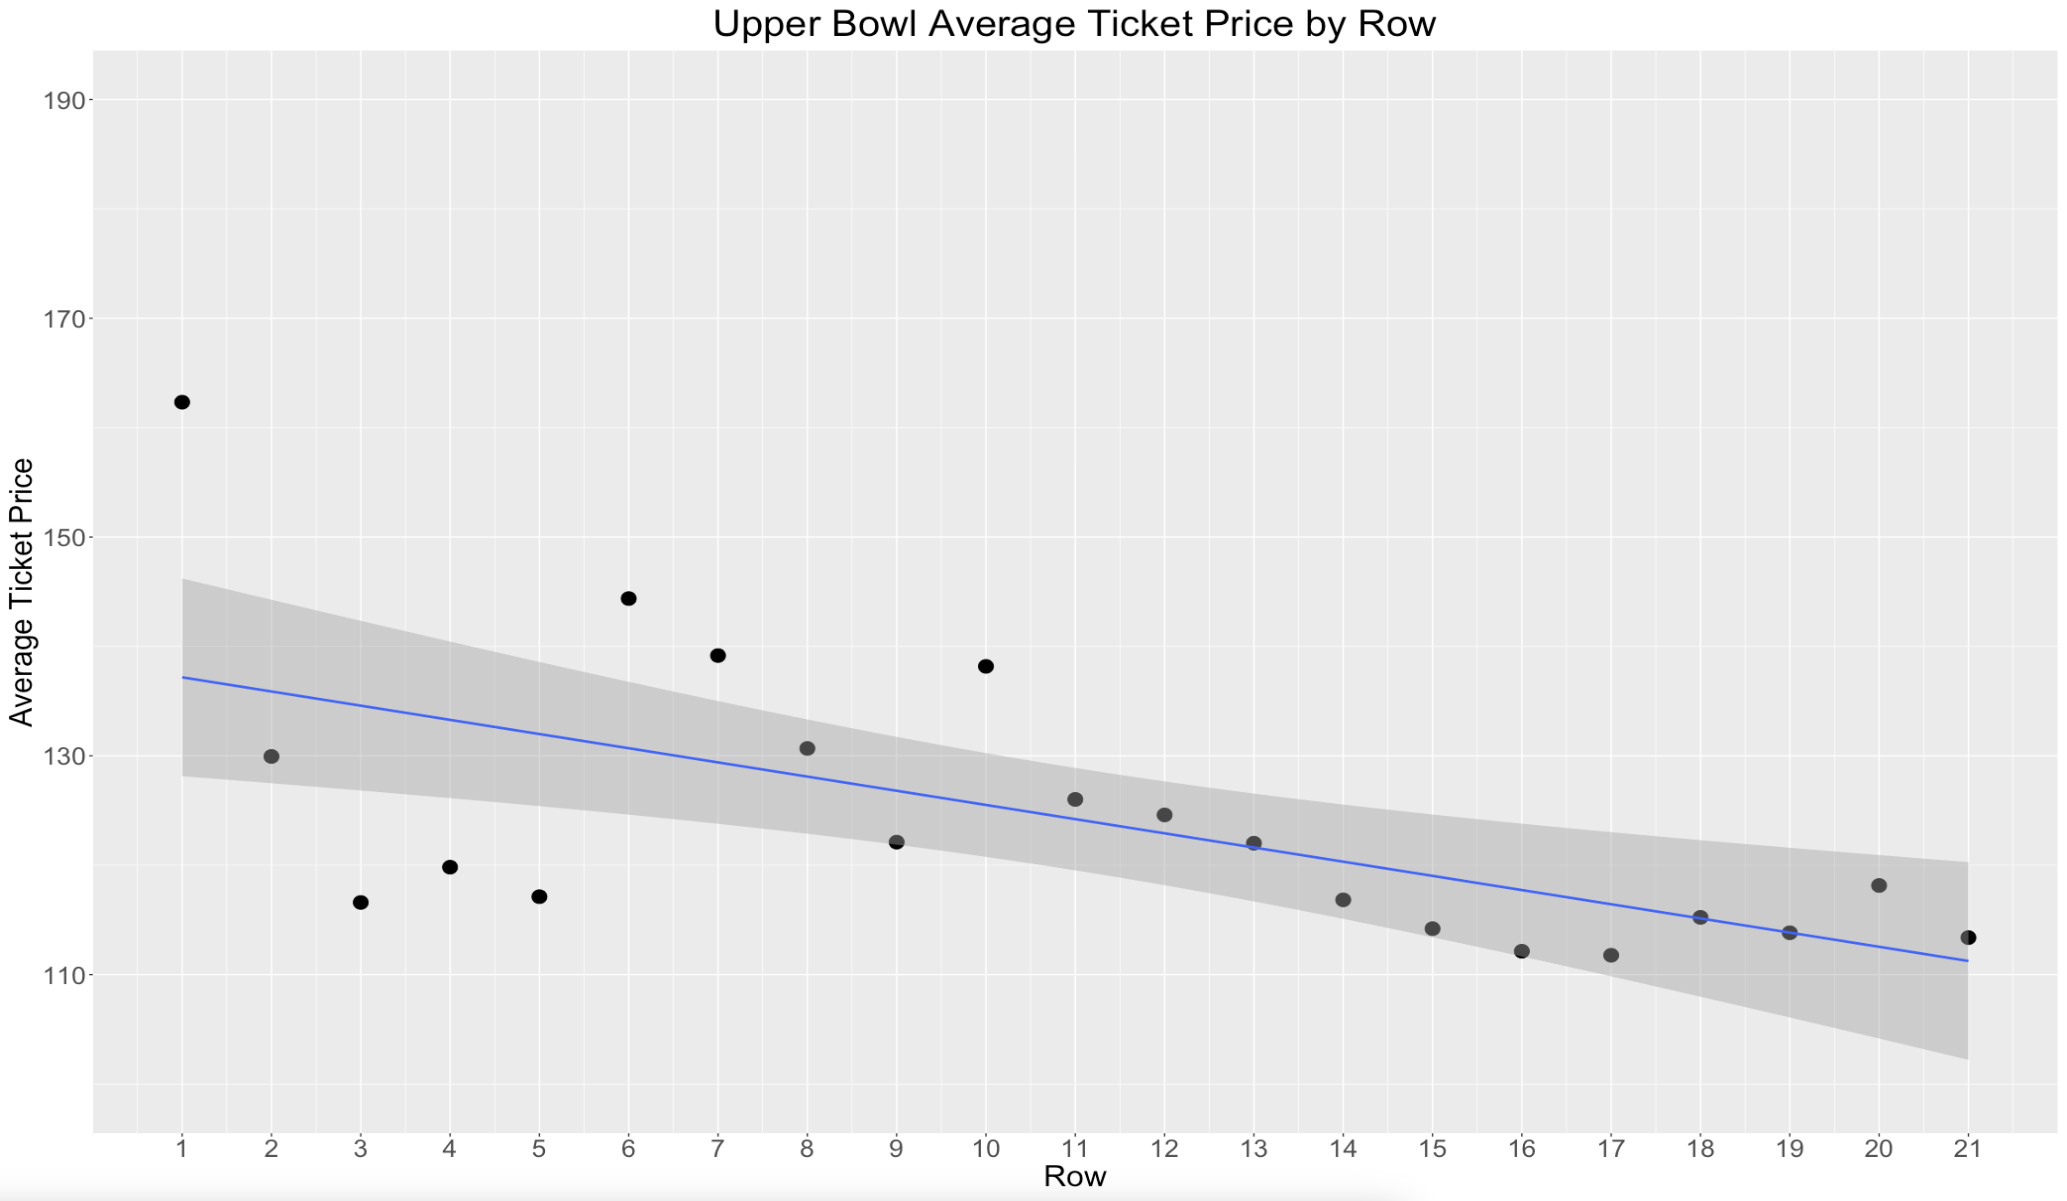
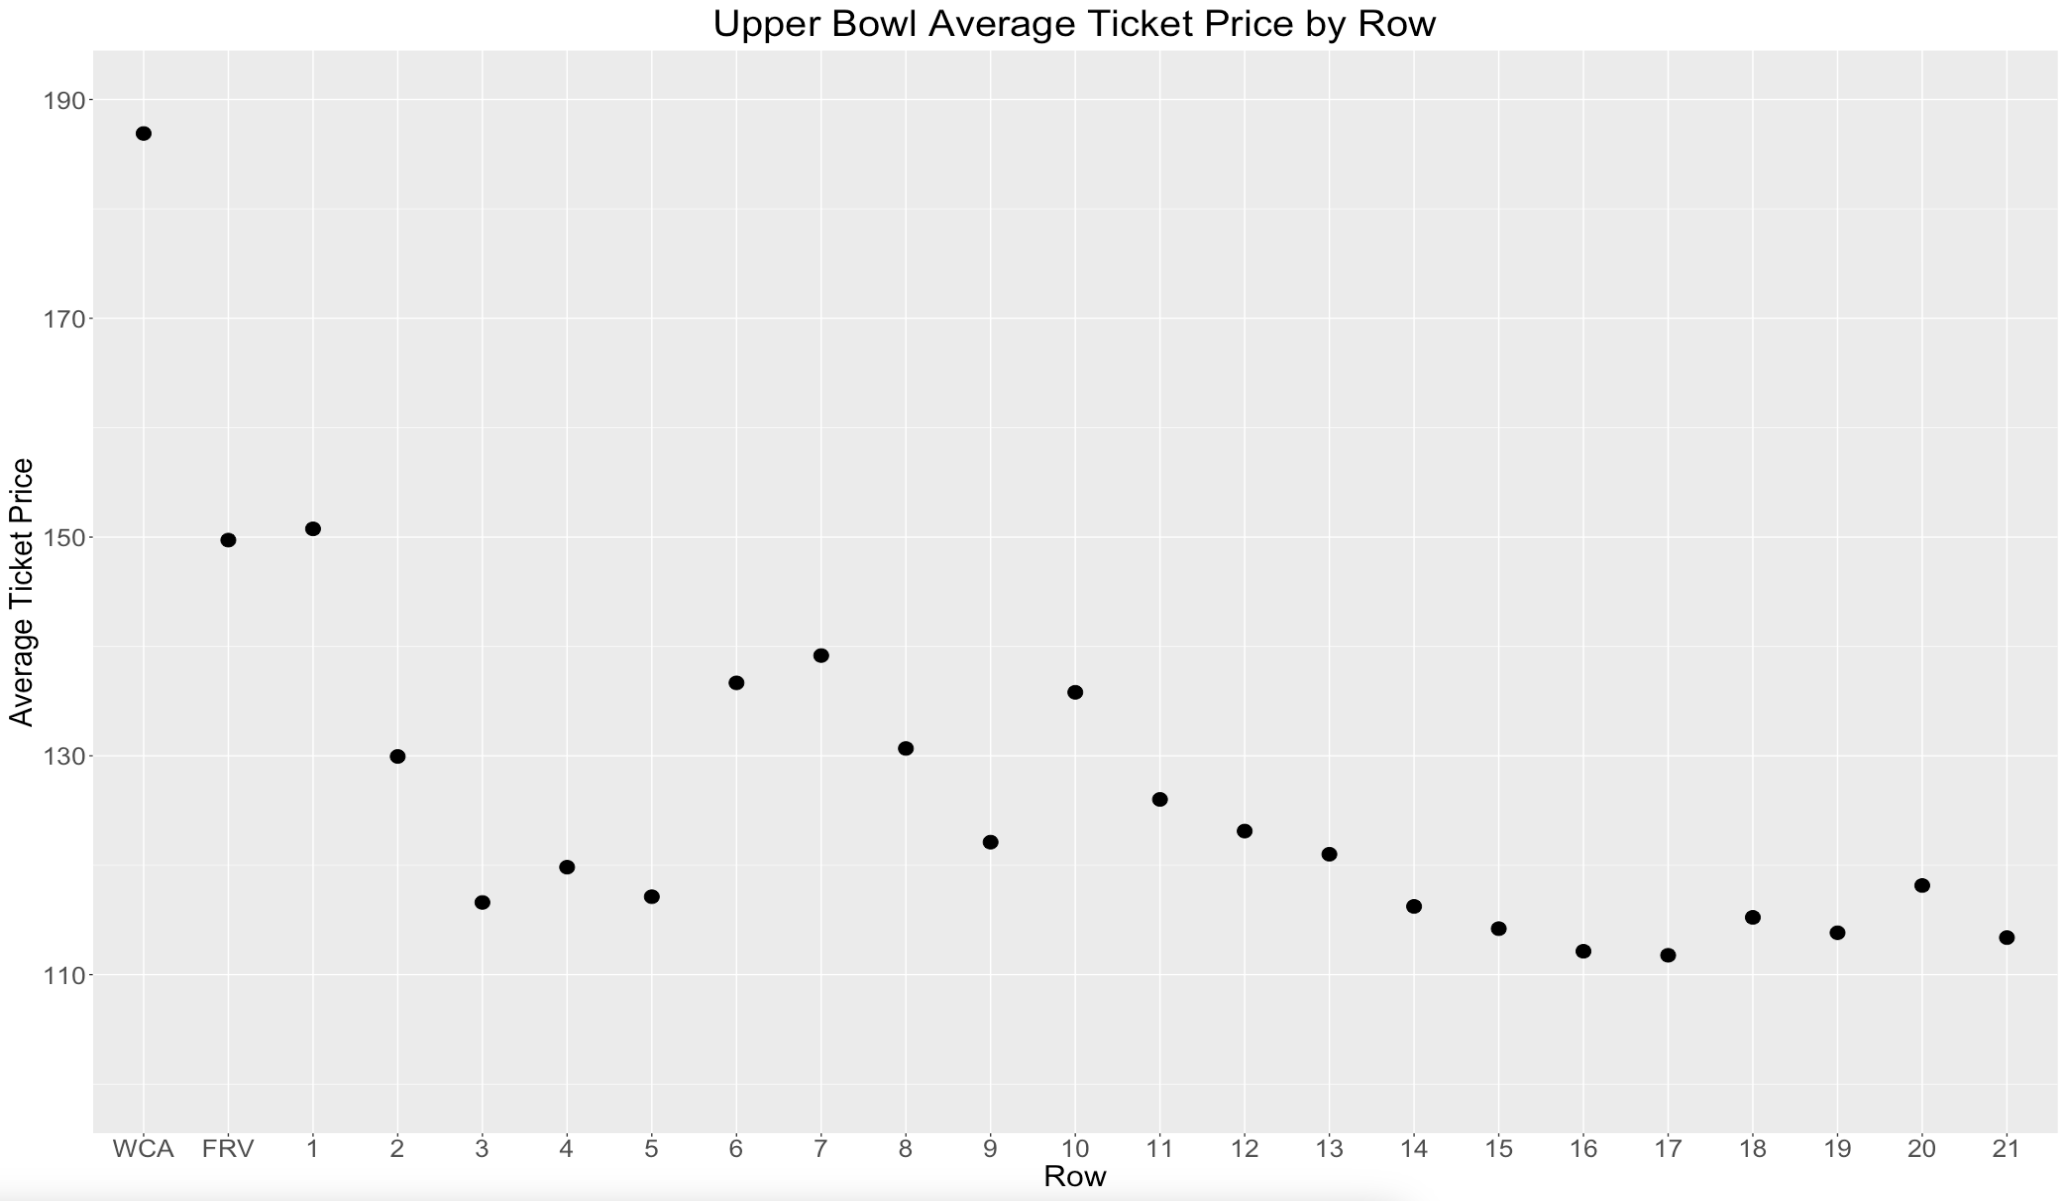
The row trend is not as strong in the upper bowl:
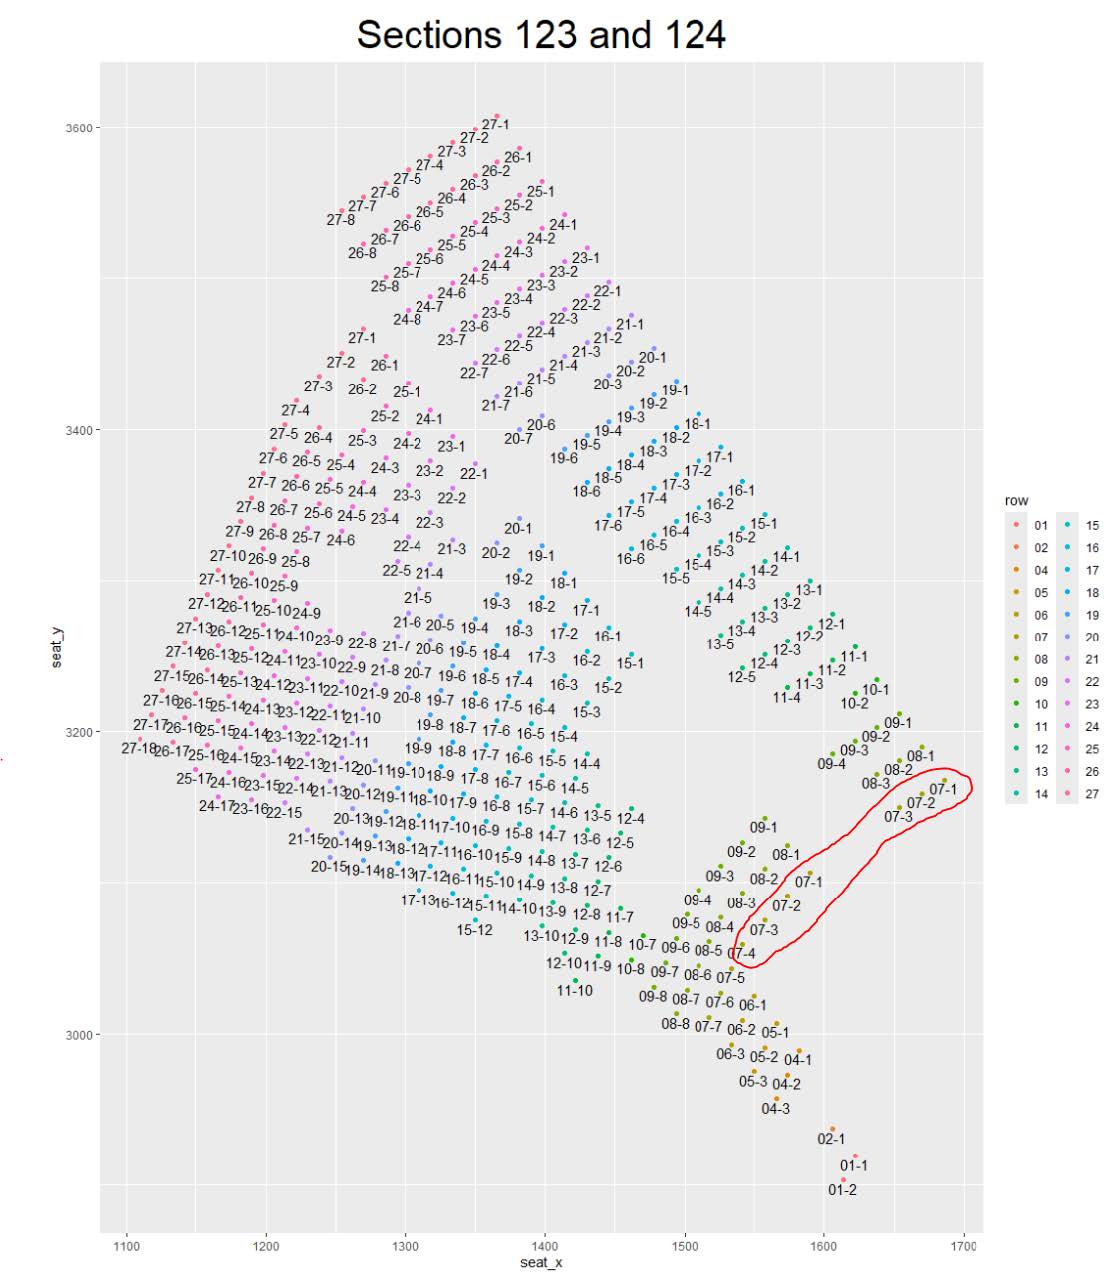
Front Row Views (FRV):
Many non-row 1 seats overhang tunnels or entrances and have no seats in front of them. I labeled these seats as front row views (Example below of seats overhanging the player tunnel):
Wheelchair Access (WCA) Areas:
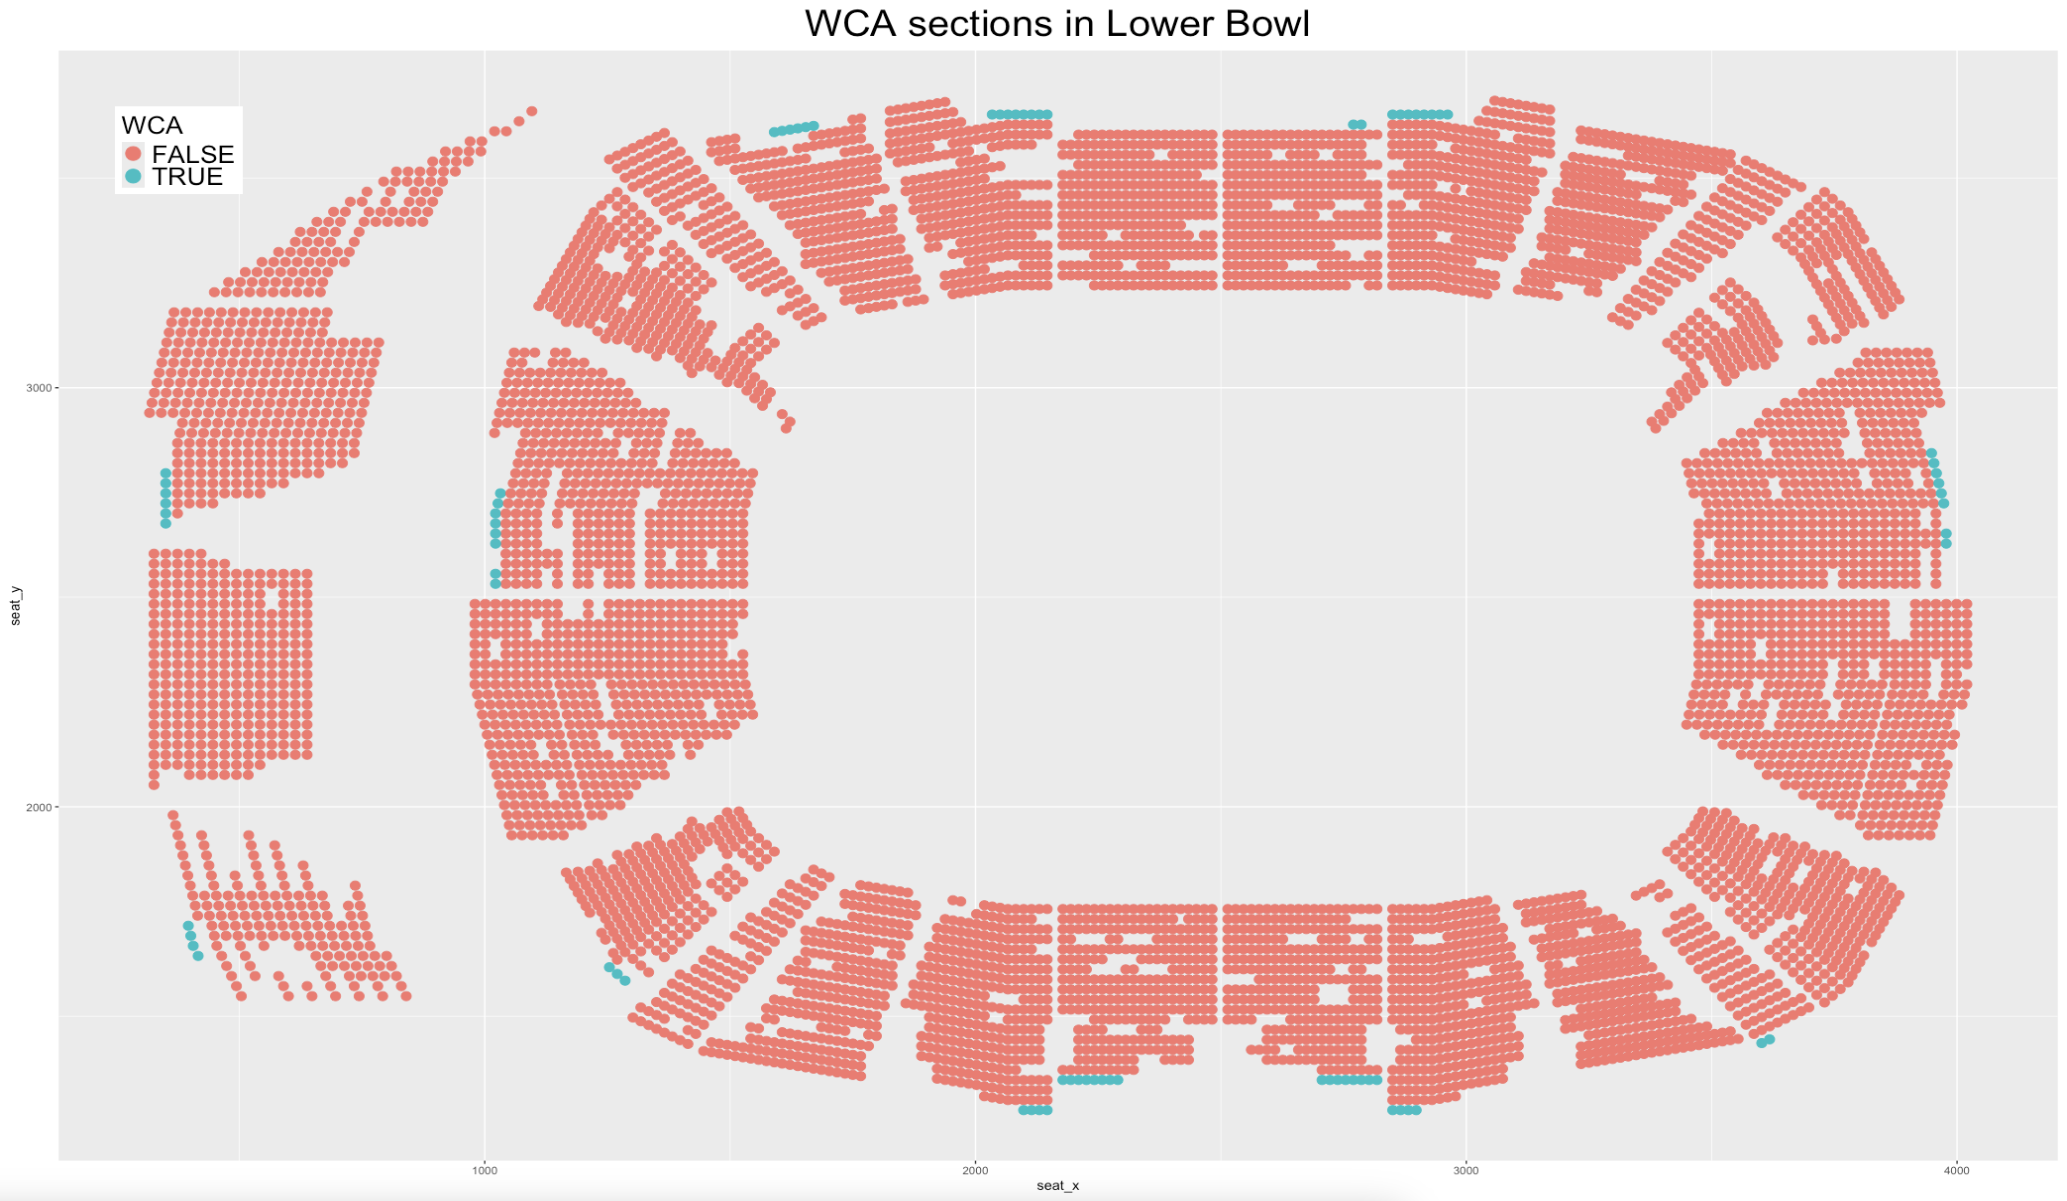
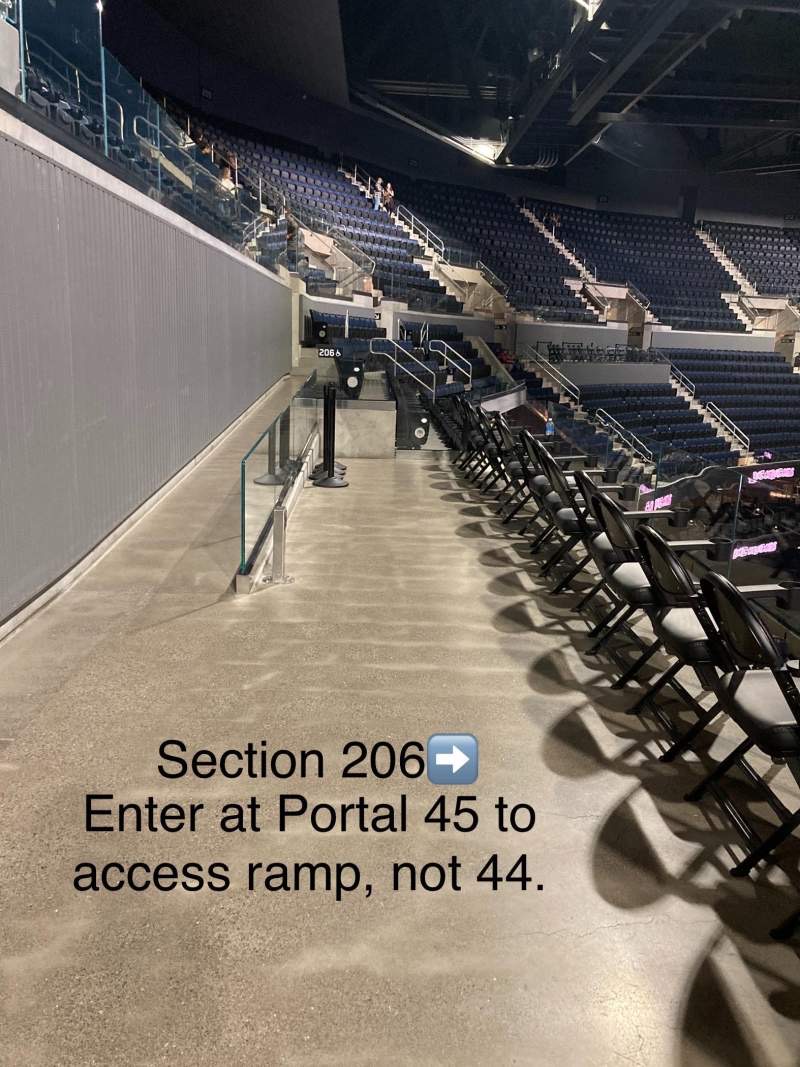
There are WCA (wheelchair access) areas in the arena. These seats are located in the back of sections in the lower bowl:
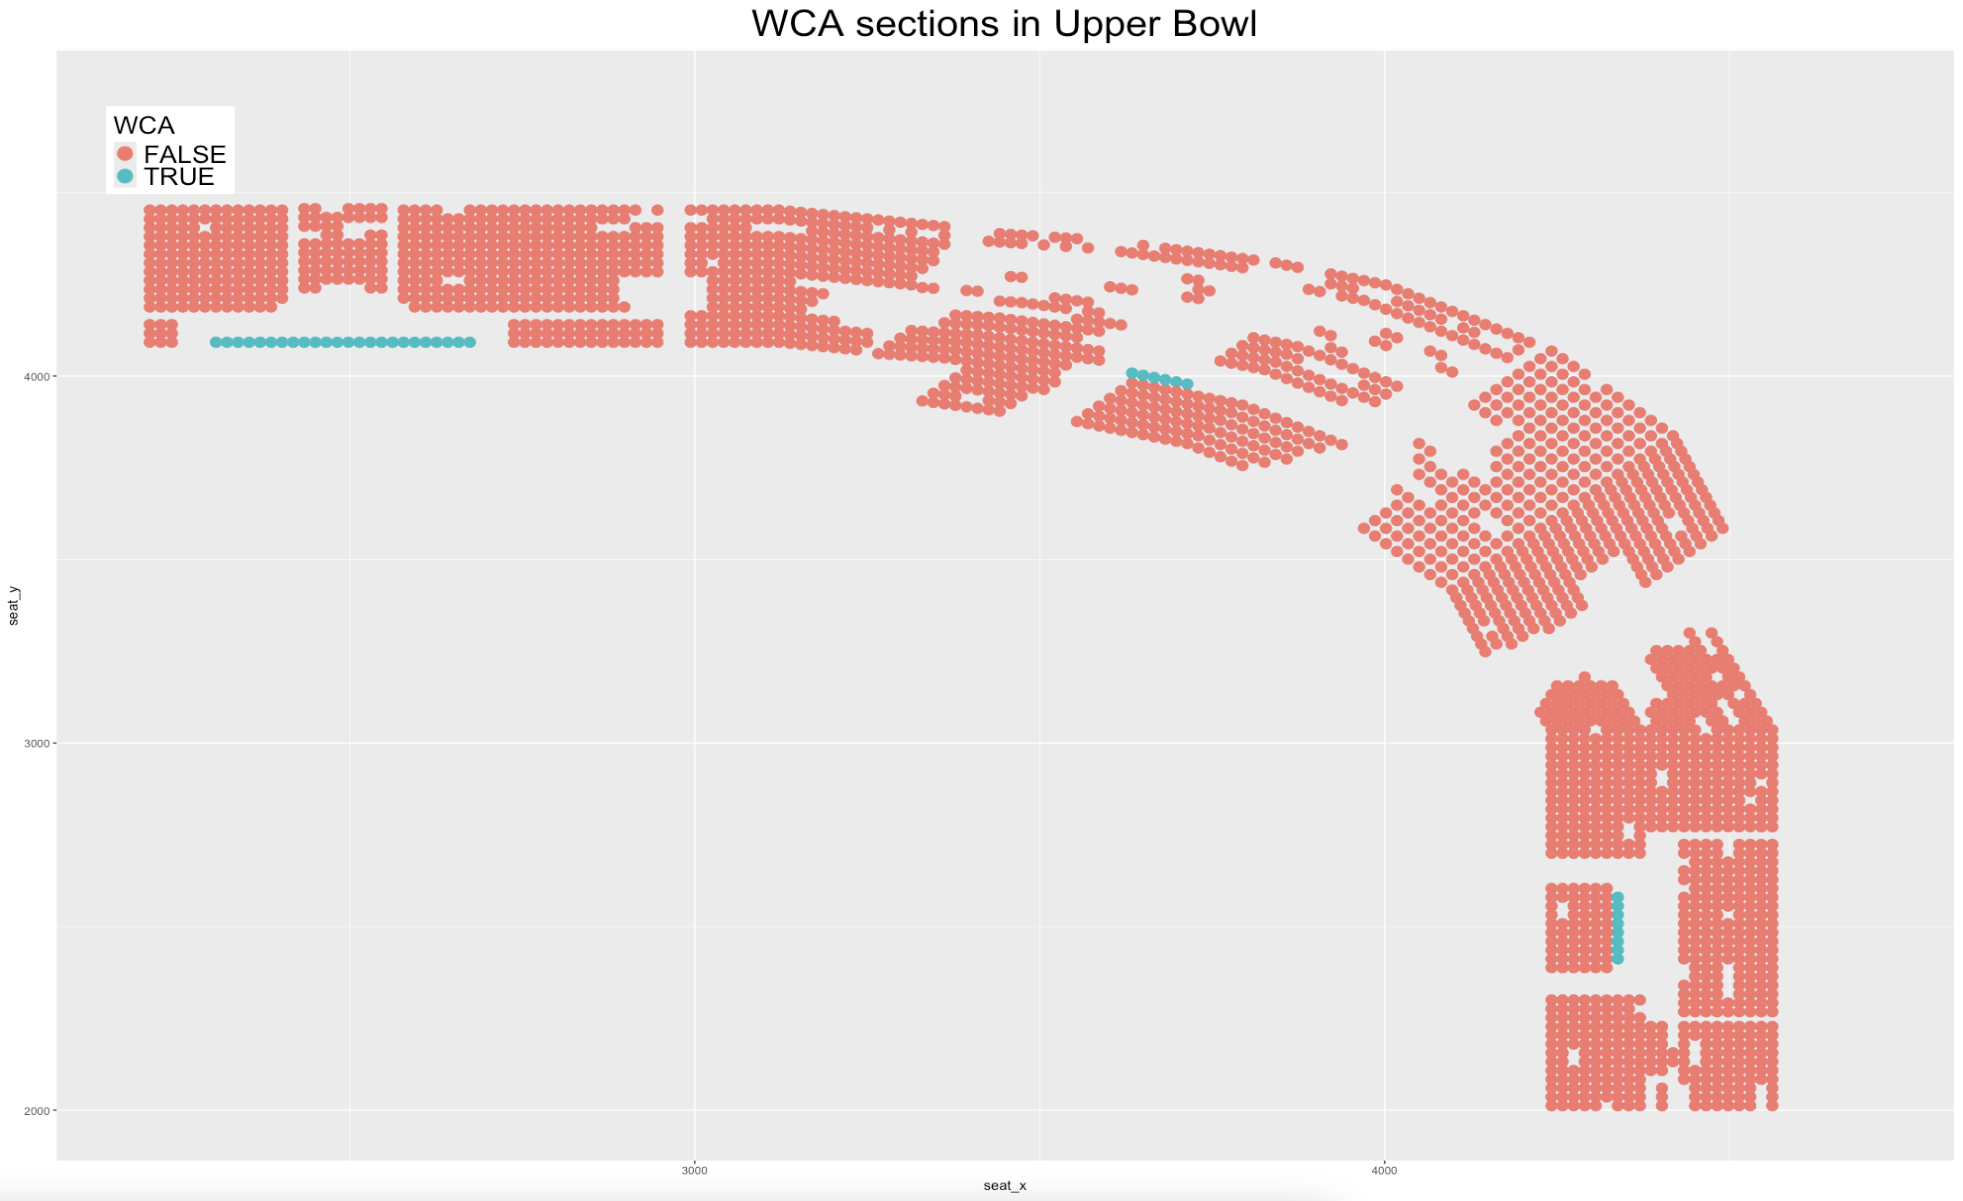
The WCA sections in the upper bowl are located in front of or in the middle of sections:
Graphs of New Rows Created:
The lower bowl front row view seats have a premium while the WCA seats are not very expensive:
The upper bowl front row view seats have similar prices to row 1 seats. The WCA seats have the highest average prices in the upper bowl:
Final Models:
Three models were created to model the ticket prices for entire stadium based on the areas broken down earlier. Many of the predictors were the same for each model, but each model was adjusted for the factors relevant in its area.
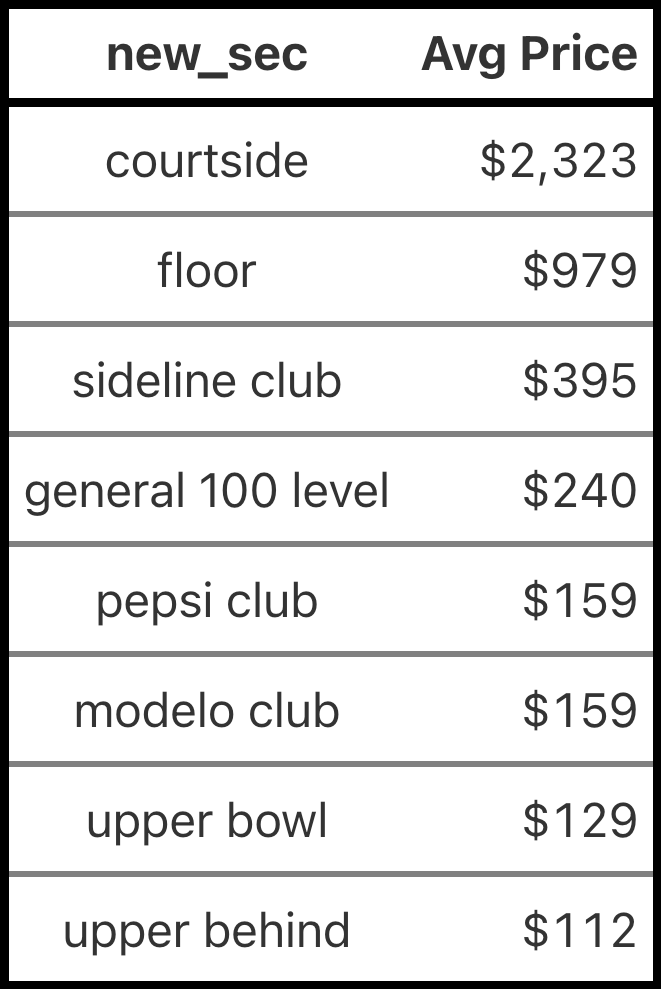
Lower Bowl Model:
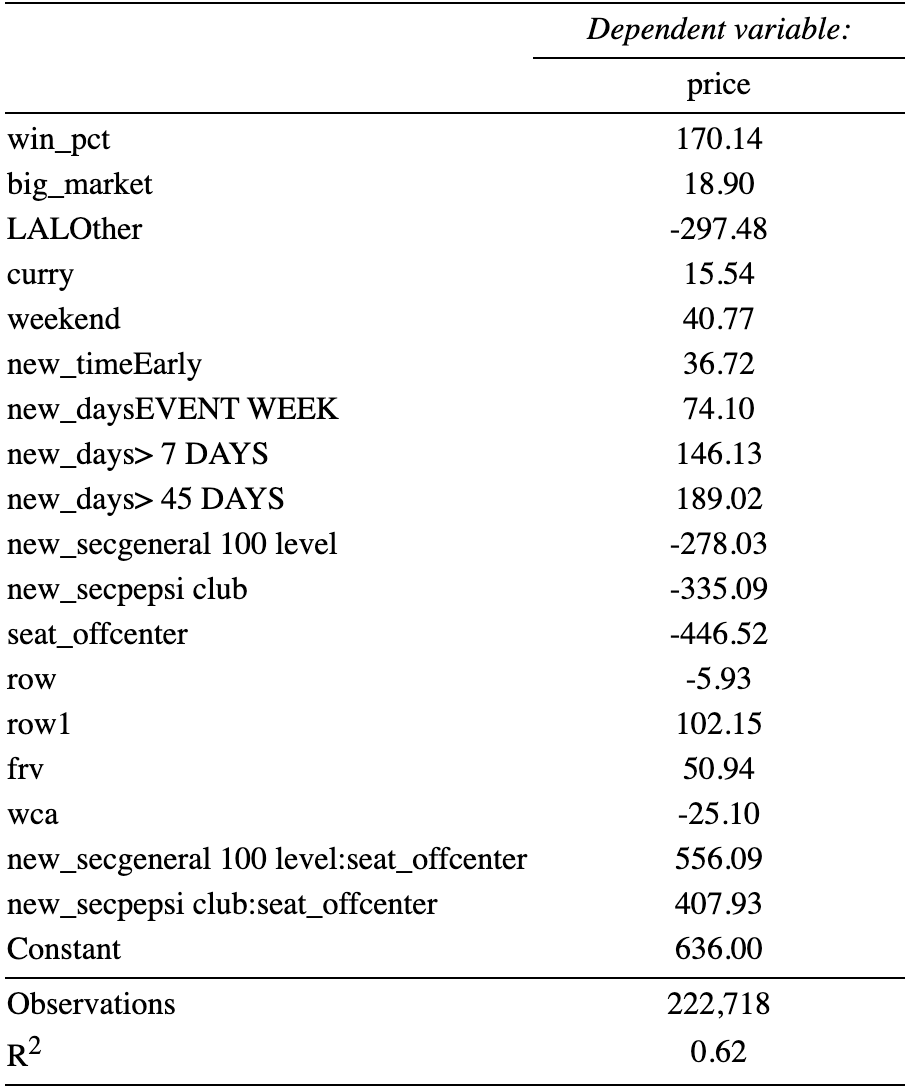
- Sideline club tickets are much more expensive, while general 100 tickets are slightly more expensive than the Pepsi club
- Tickets closer to the center of the court are much more expensive
- Tickets prices drop around $6 every row you go back
- Row 1 tickets are predicted $100 more espensive than the seat directly behind them
- Front row view seats (not row 1) are predicted $50 more than the seat directly behind them
- Wheelchair areas are the cheapest seats in the lower bowl
The following graph shows predicted lower bowl prices for a specific game:
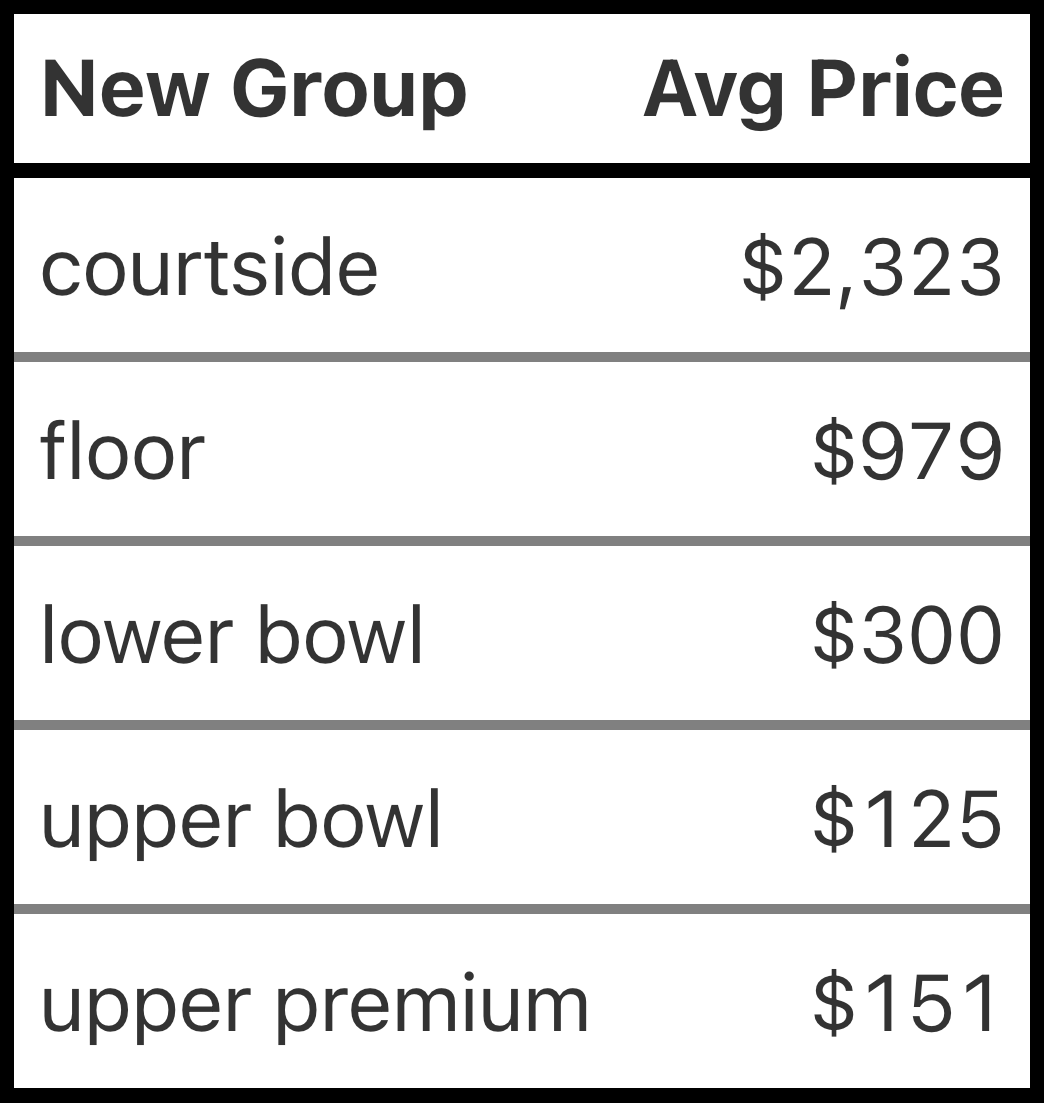
Upper Bowl Model:
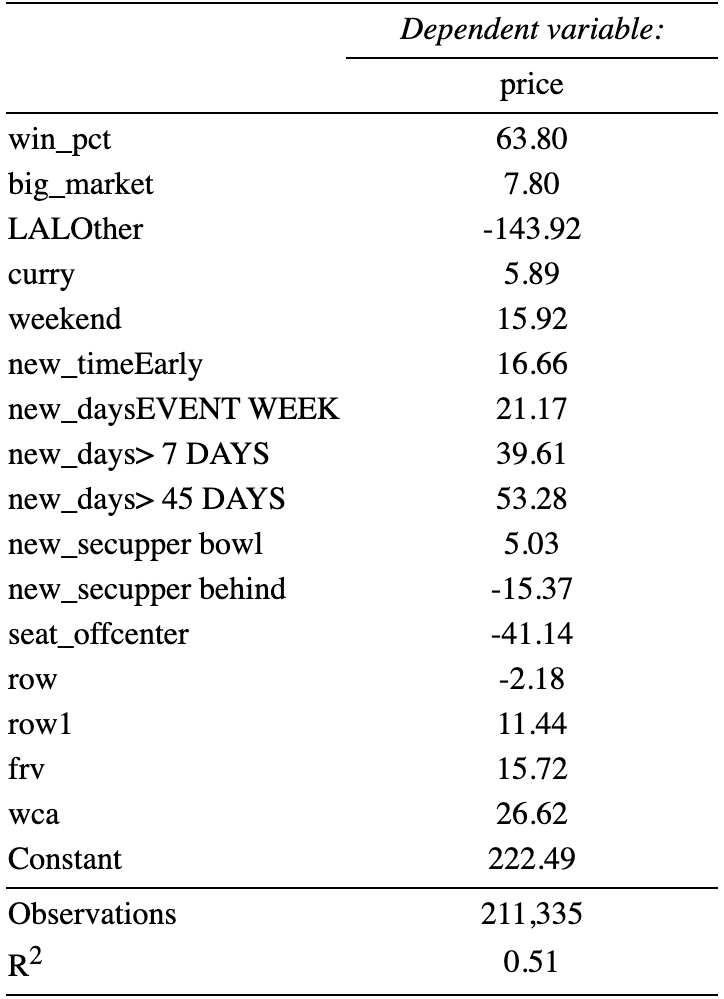
- Upper behind seats are cheaper than upper bowl and upper premium
- Predicted prices decrease as you go closer to the corners of the arena
- Ticket prices drop around $2 every row you go back
- Row 1 seats are predicted to be roughly $11 more than the seat directly behind them
- Front row view seats (not row 1) are predicted $15 more than the seat directly behind them
- Unlike the lower bowl, wheelchair access sections contain the most expensive upper bowl seats
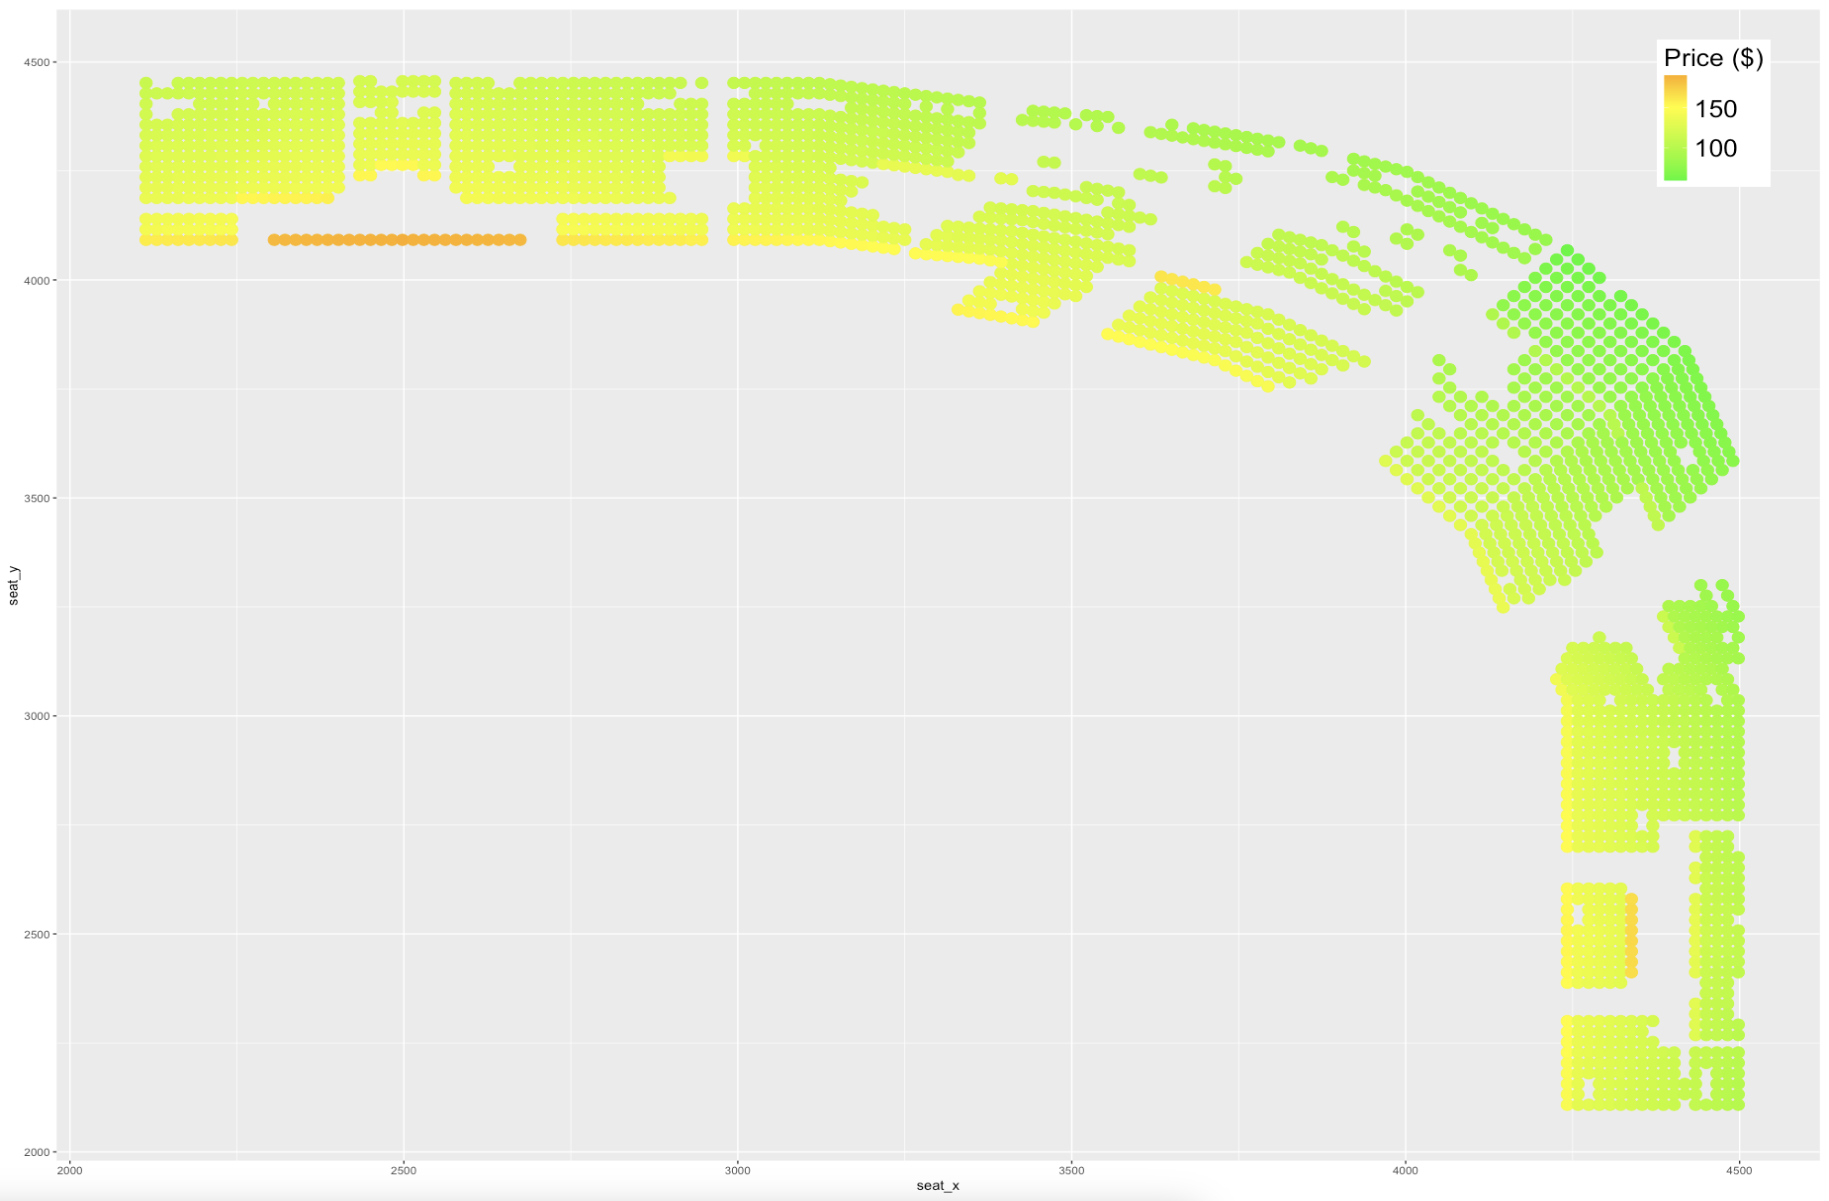
The following graph shows predicted upper bowl prices while holding external factors constant:
Courtside Model:
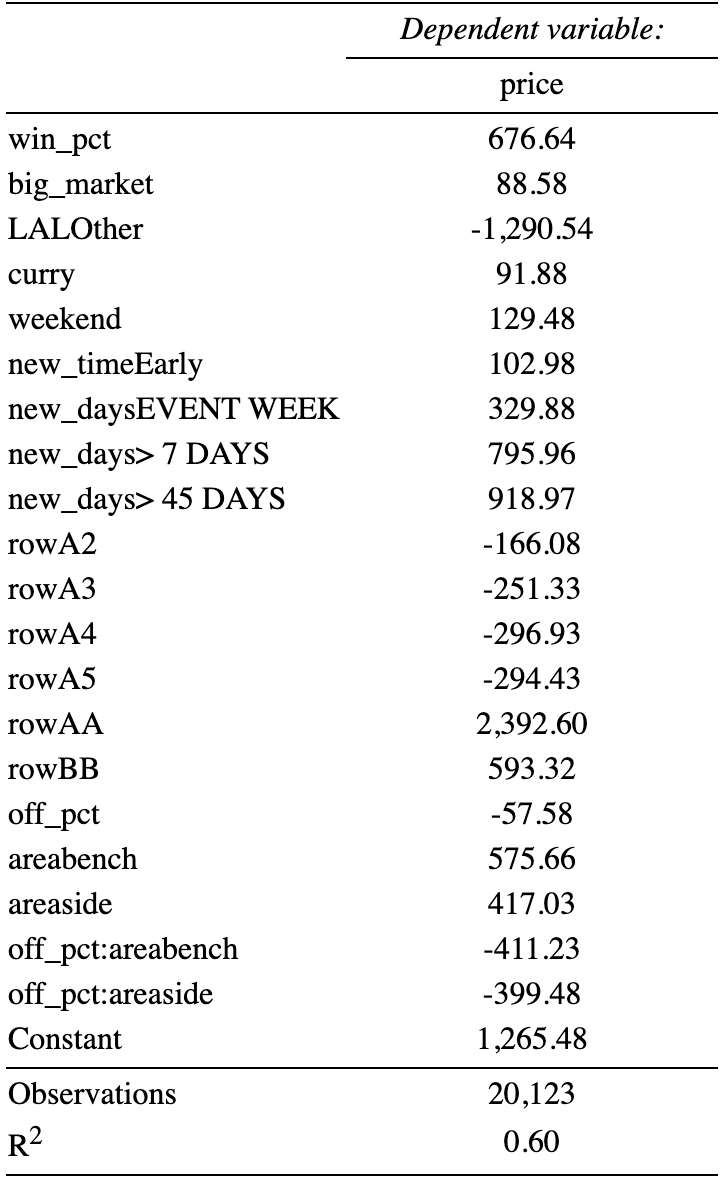
- True front row seats are predicted to be worth roughly $1800 more than the seat directly behind them
- Predicted prices drop around $600 when going from row BB (true row 2) to A1 (the section behind)
- Tickets in the middle are more expensive (unless sitting behind the baskets)
Courtside graph (size of seat is predicted price):
Other Model Takeaways:
All three models back up the earlier findings regarding external game factors:
- Better & bigger market opponents lead to higher prices
- Prices are higher in games where Steph Curry plays
- Friday & Saturday games are the most expensive
- Games before 7:30 are more expensive
- Tickets get cheaper as the event approaches