Gallery
Skip to:
Arena Mapping:
All Arena Maps were created using the ggplot2 package in r
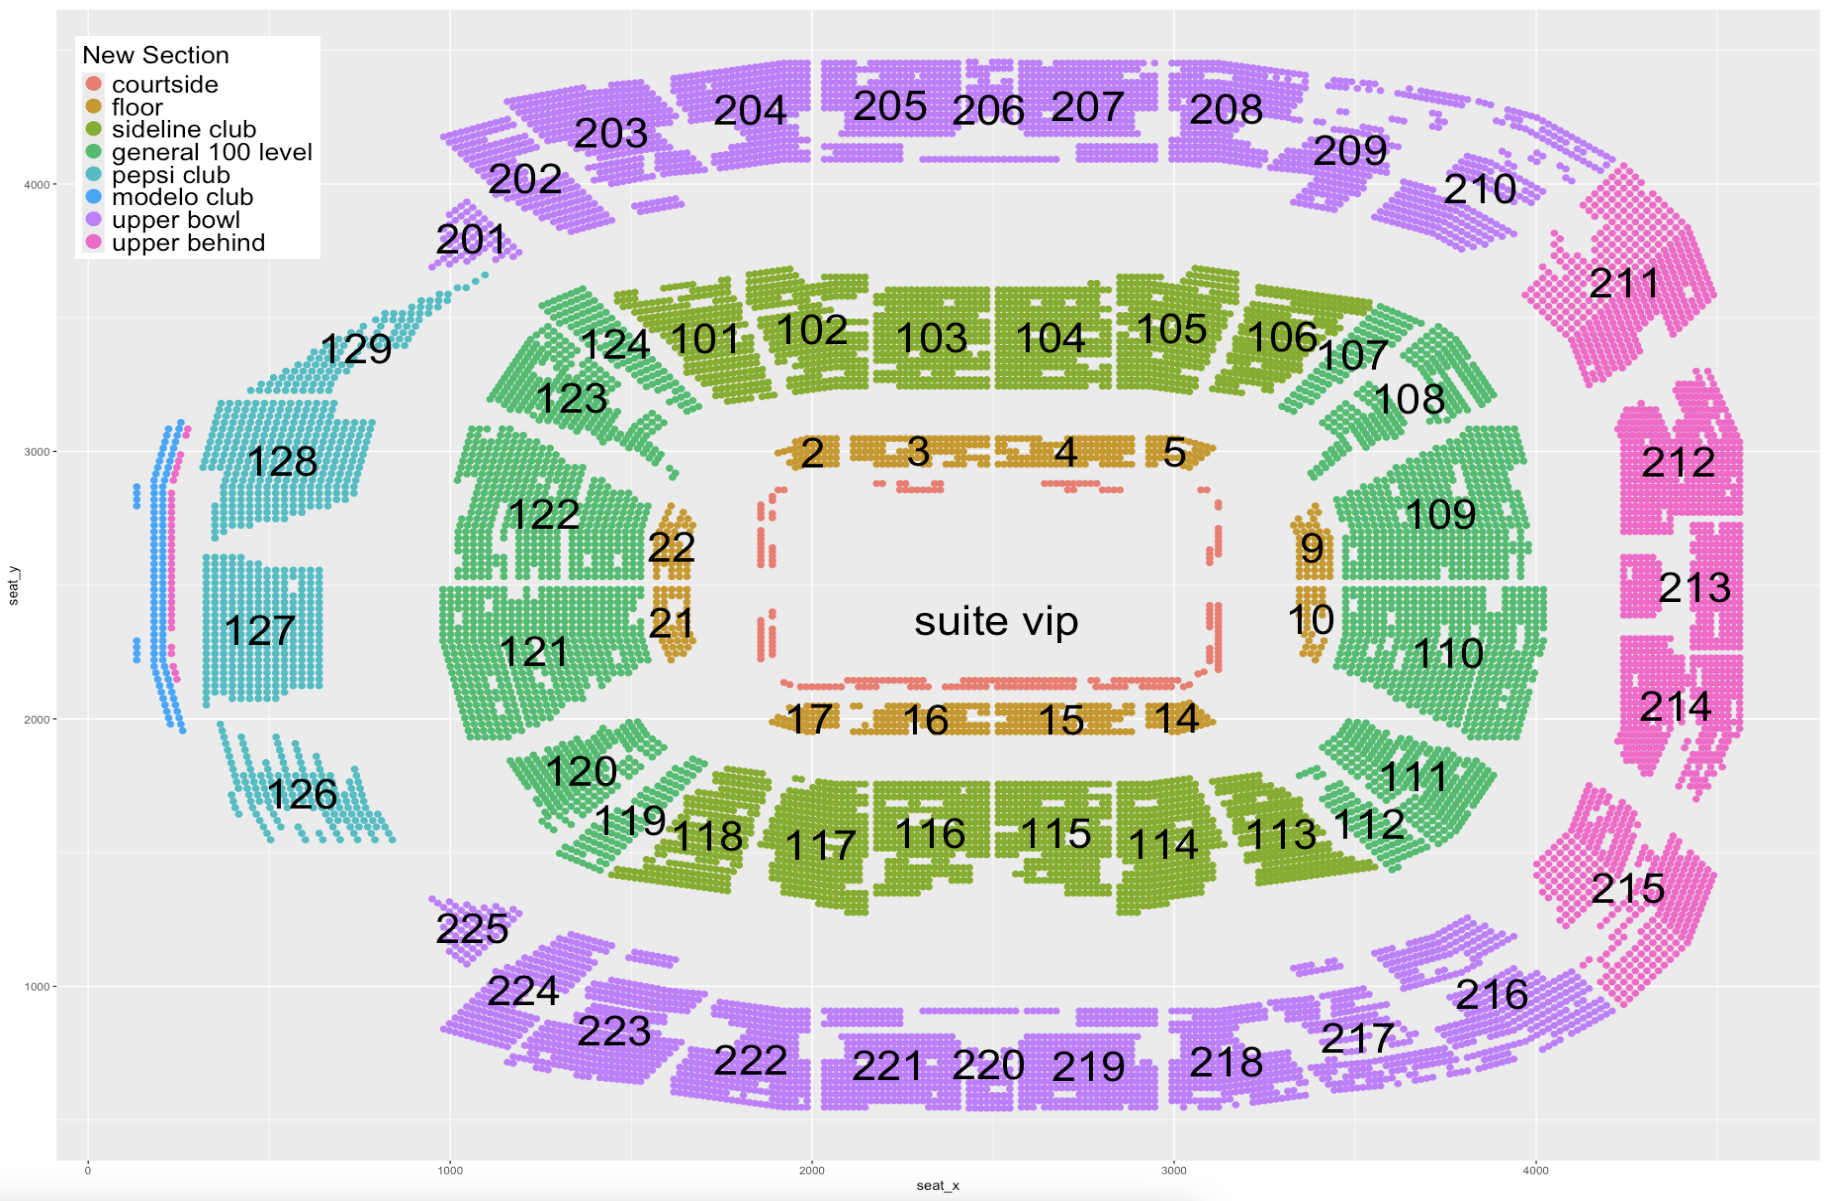
Section Mapping:
Section Map of Chase Center:
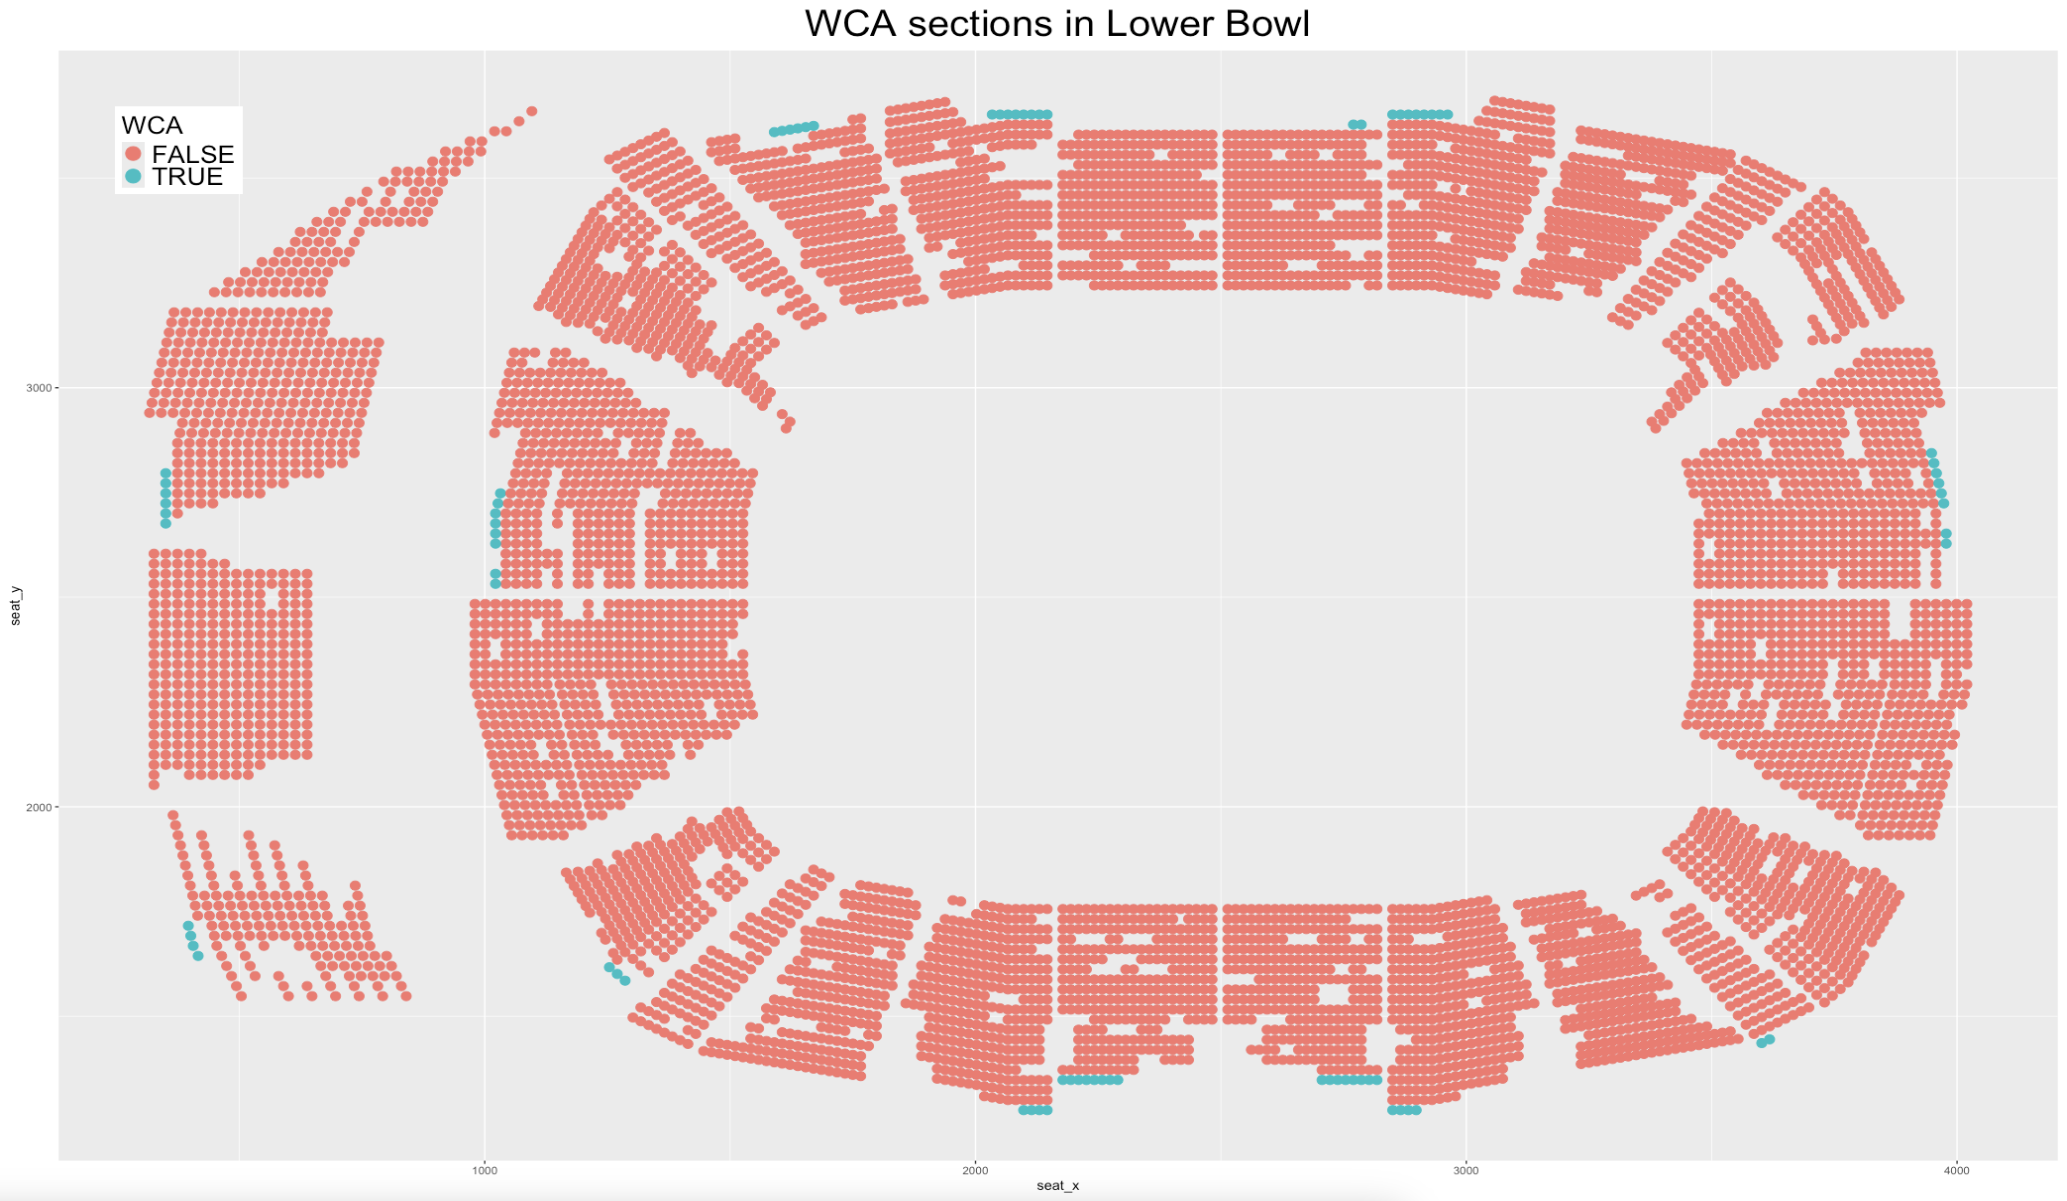
Highlighting Lower Bowl WCA Seating:
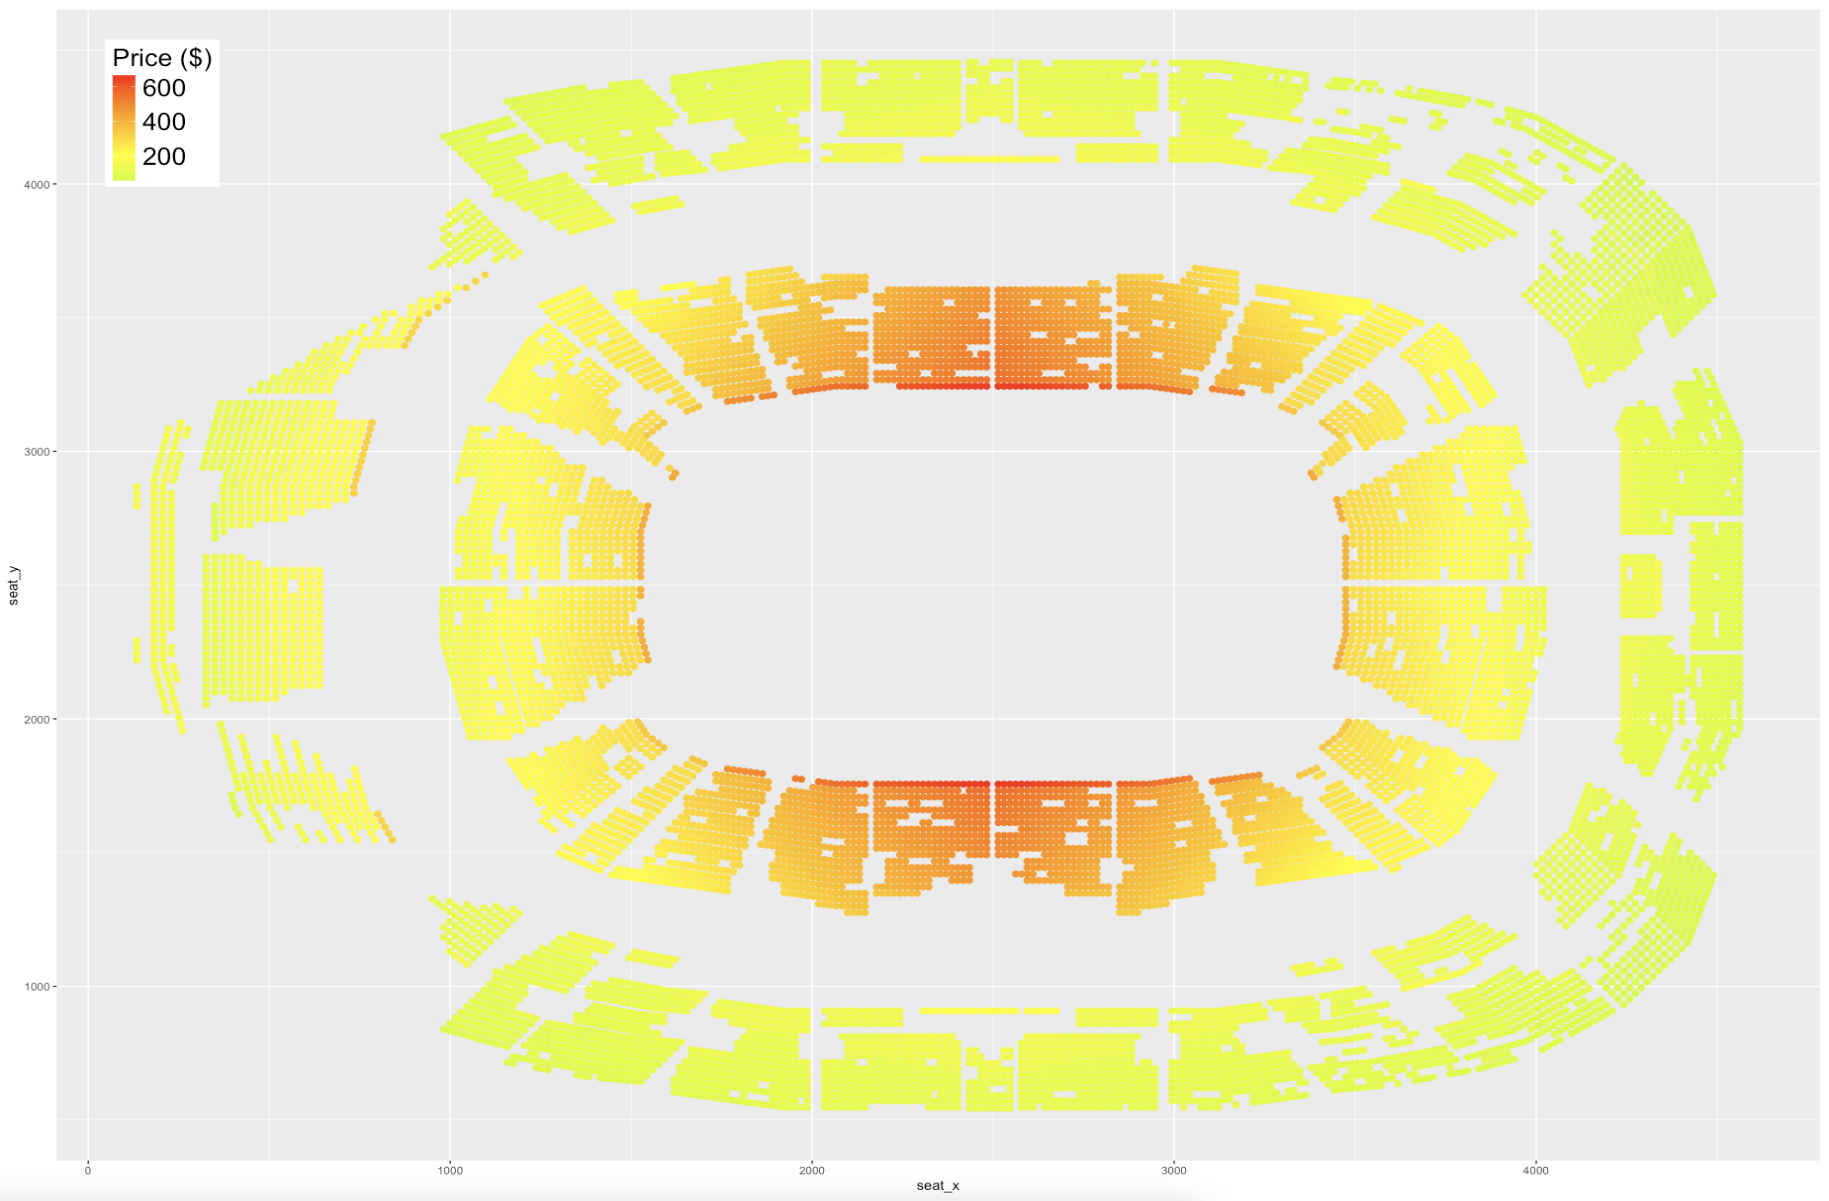
Predicted Seat Price Graphs:
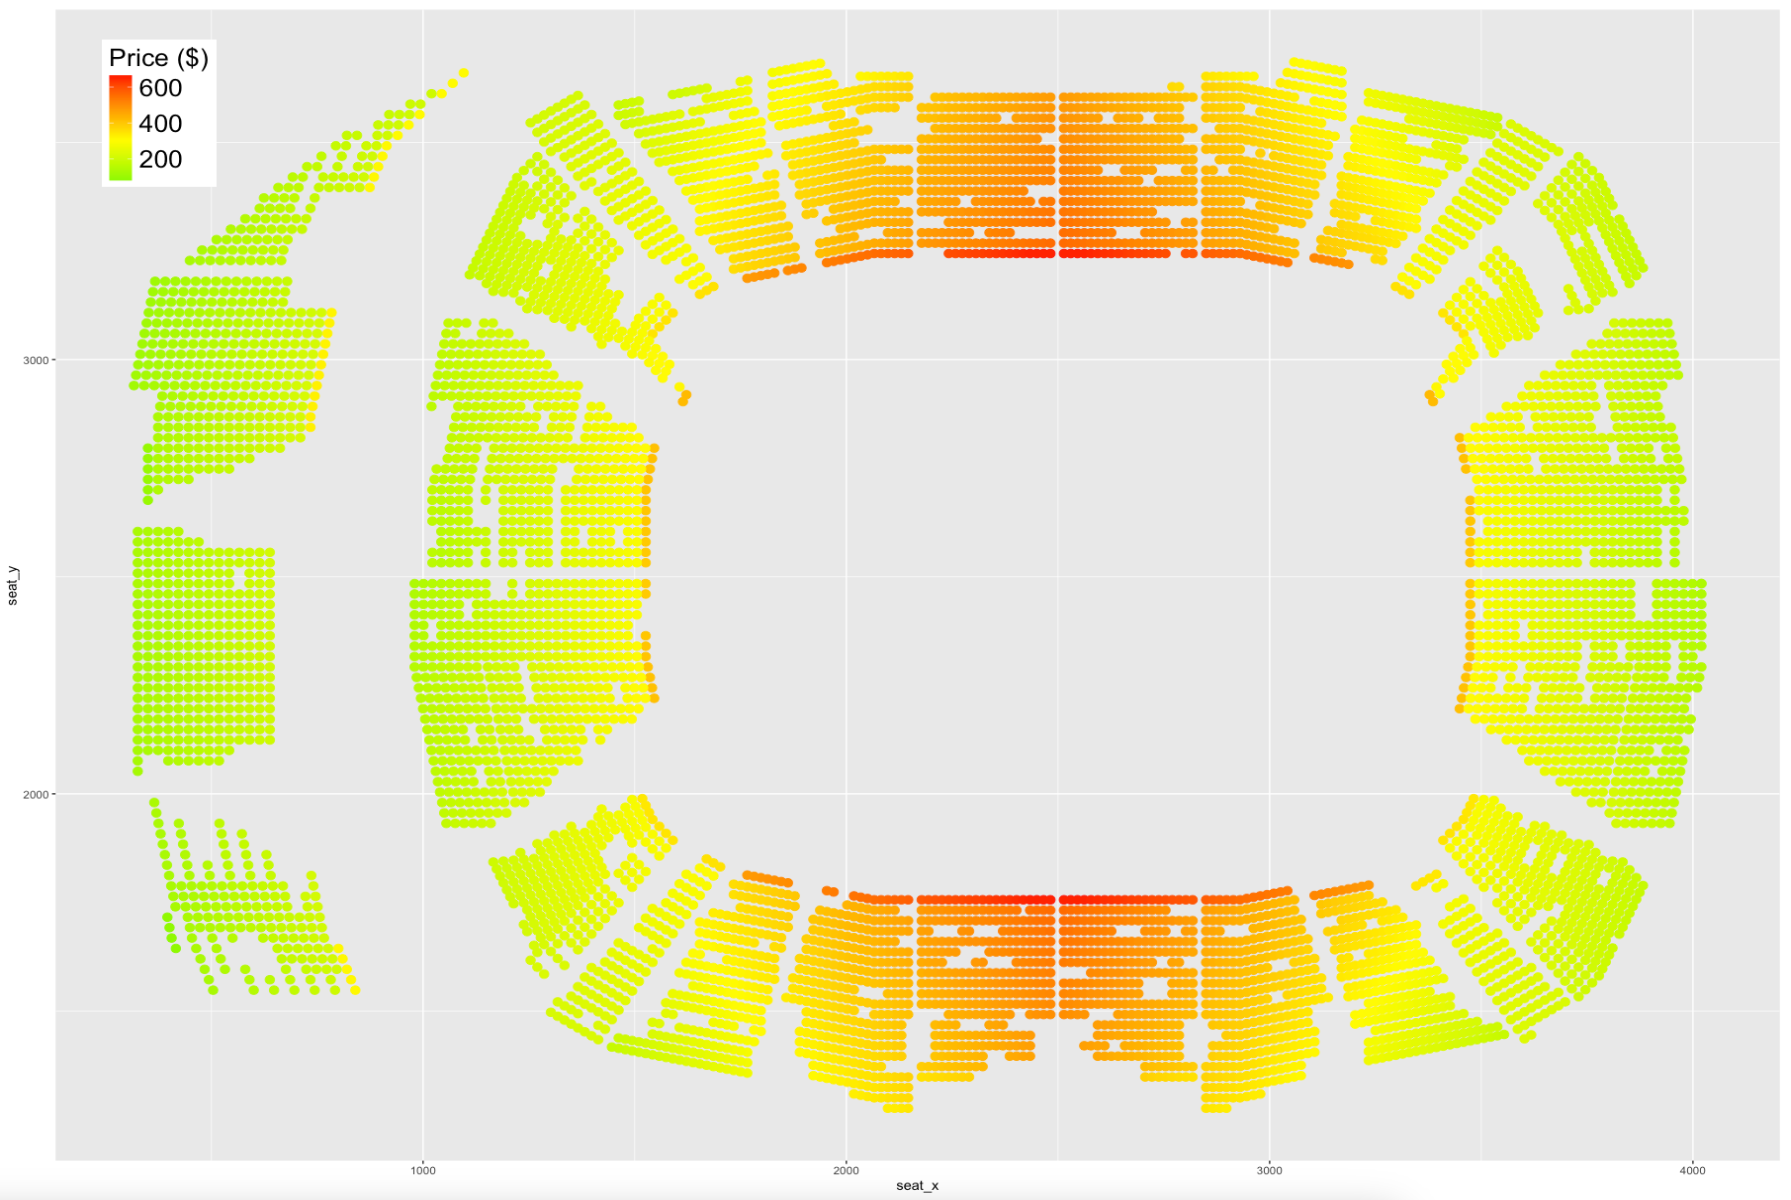
Whole Arena Heatmap (red is most expensive):
Lower Bowl Heatmap (red is most expensive):
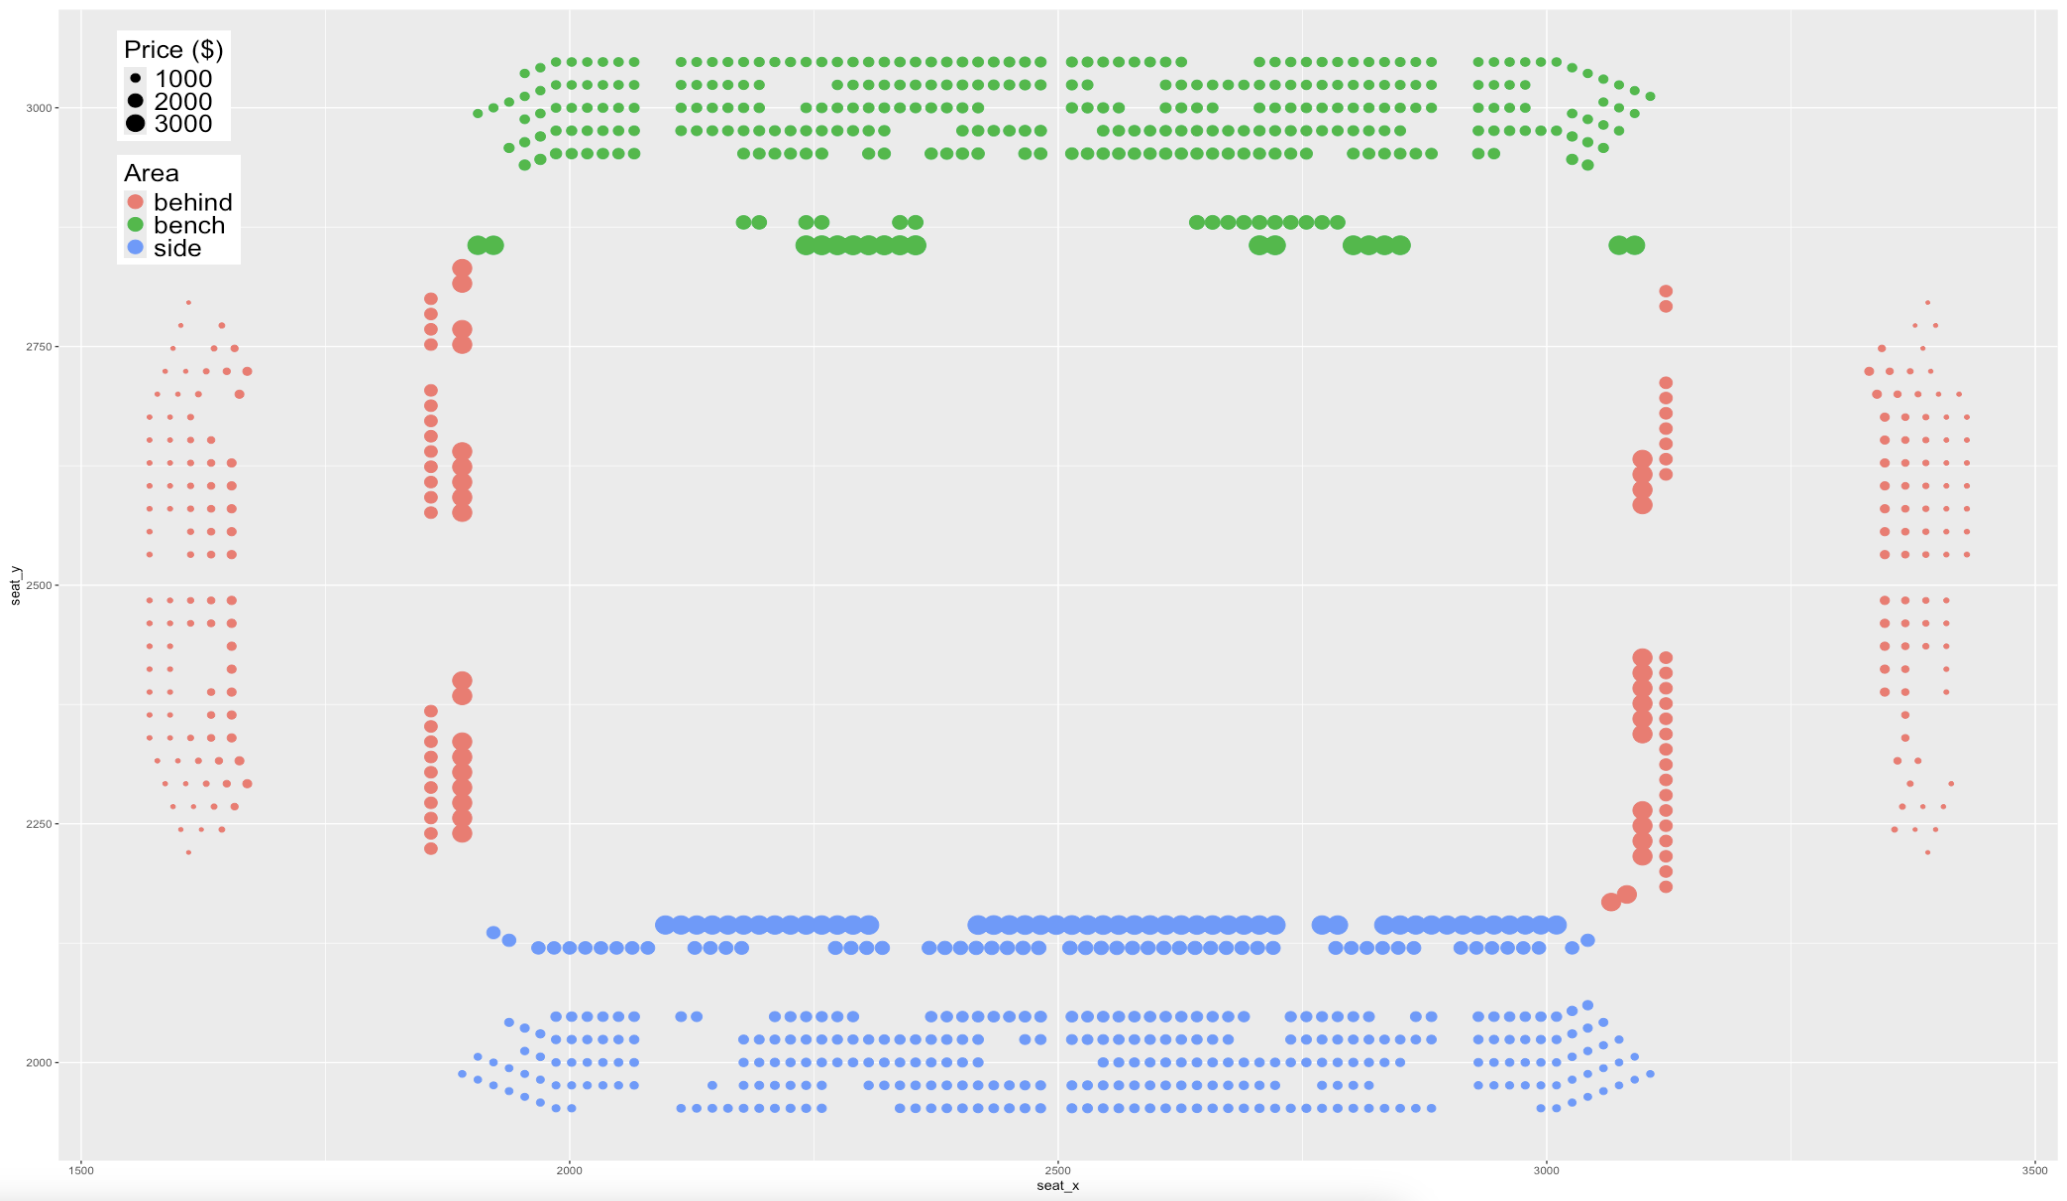
Courtside Graph (size is predicted price of seat):
Statistical Graphs:
All Statistical Graphs were created using the ggplot2 package in r
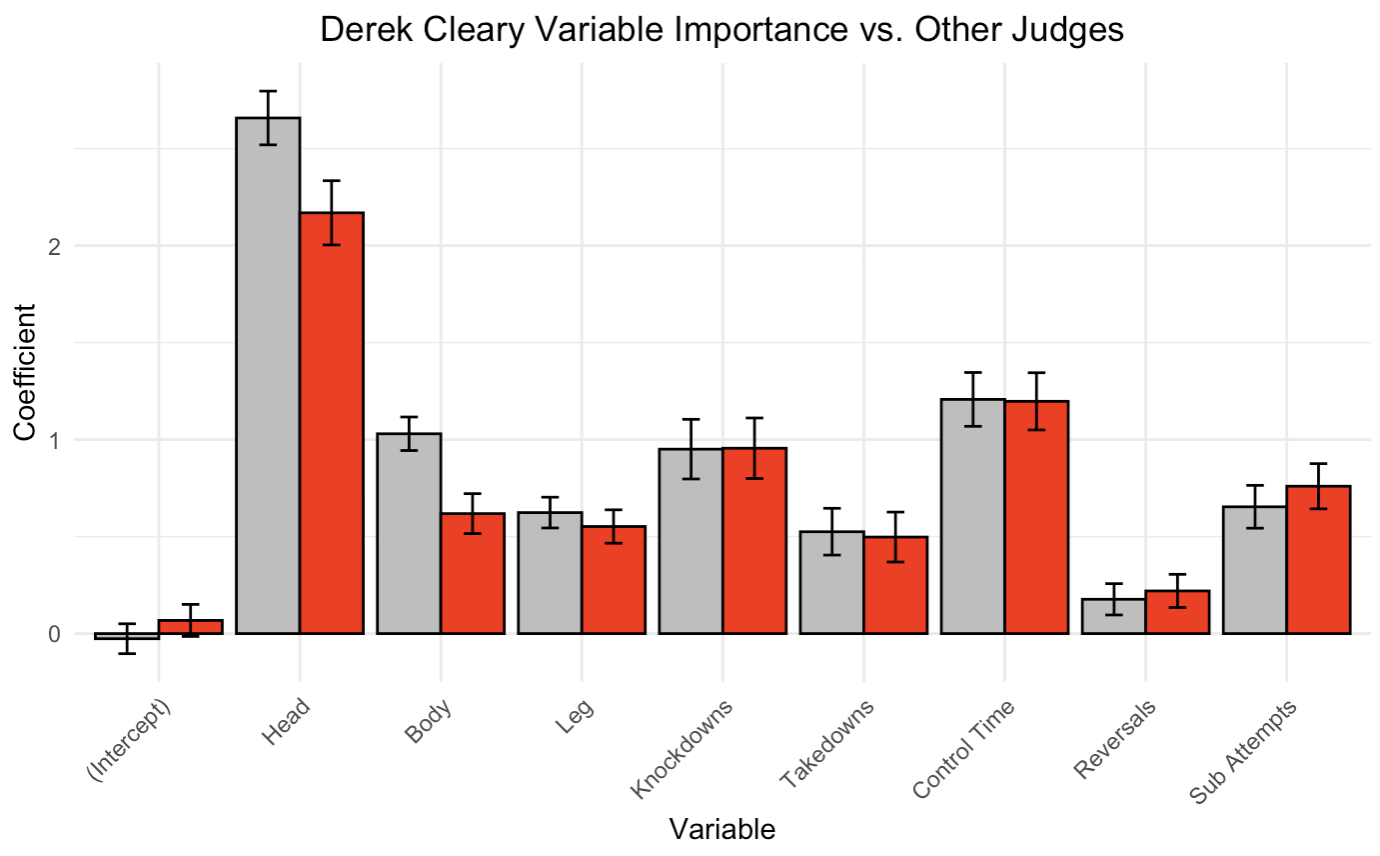
UFC Judge Tendencies (red is how Cleary scores, grey is how other judges score):
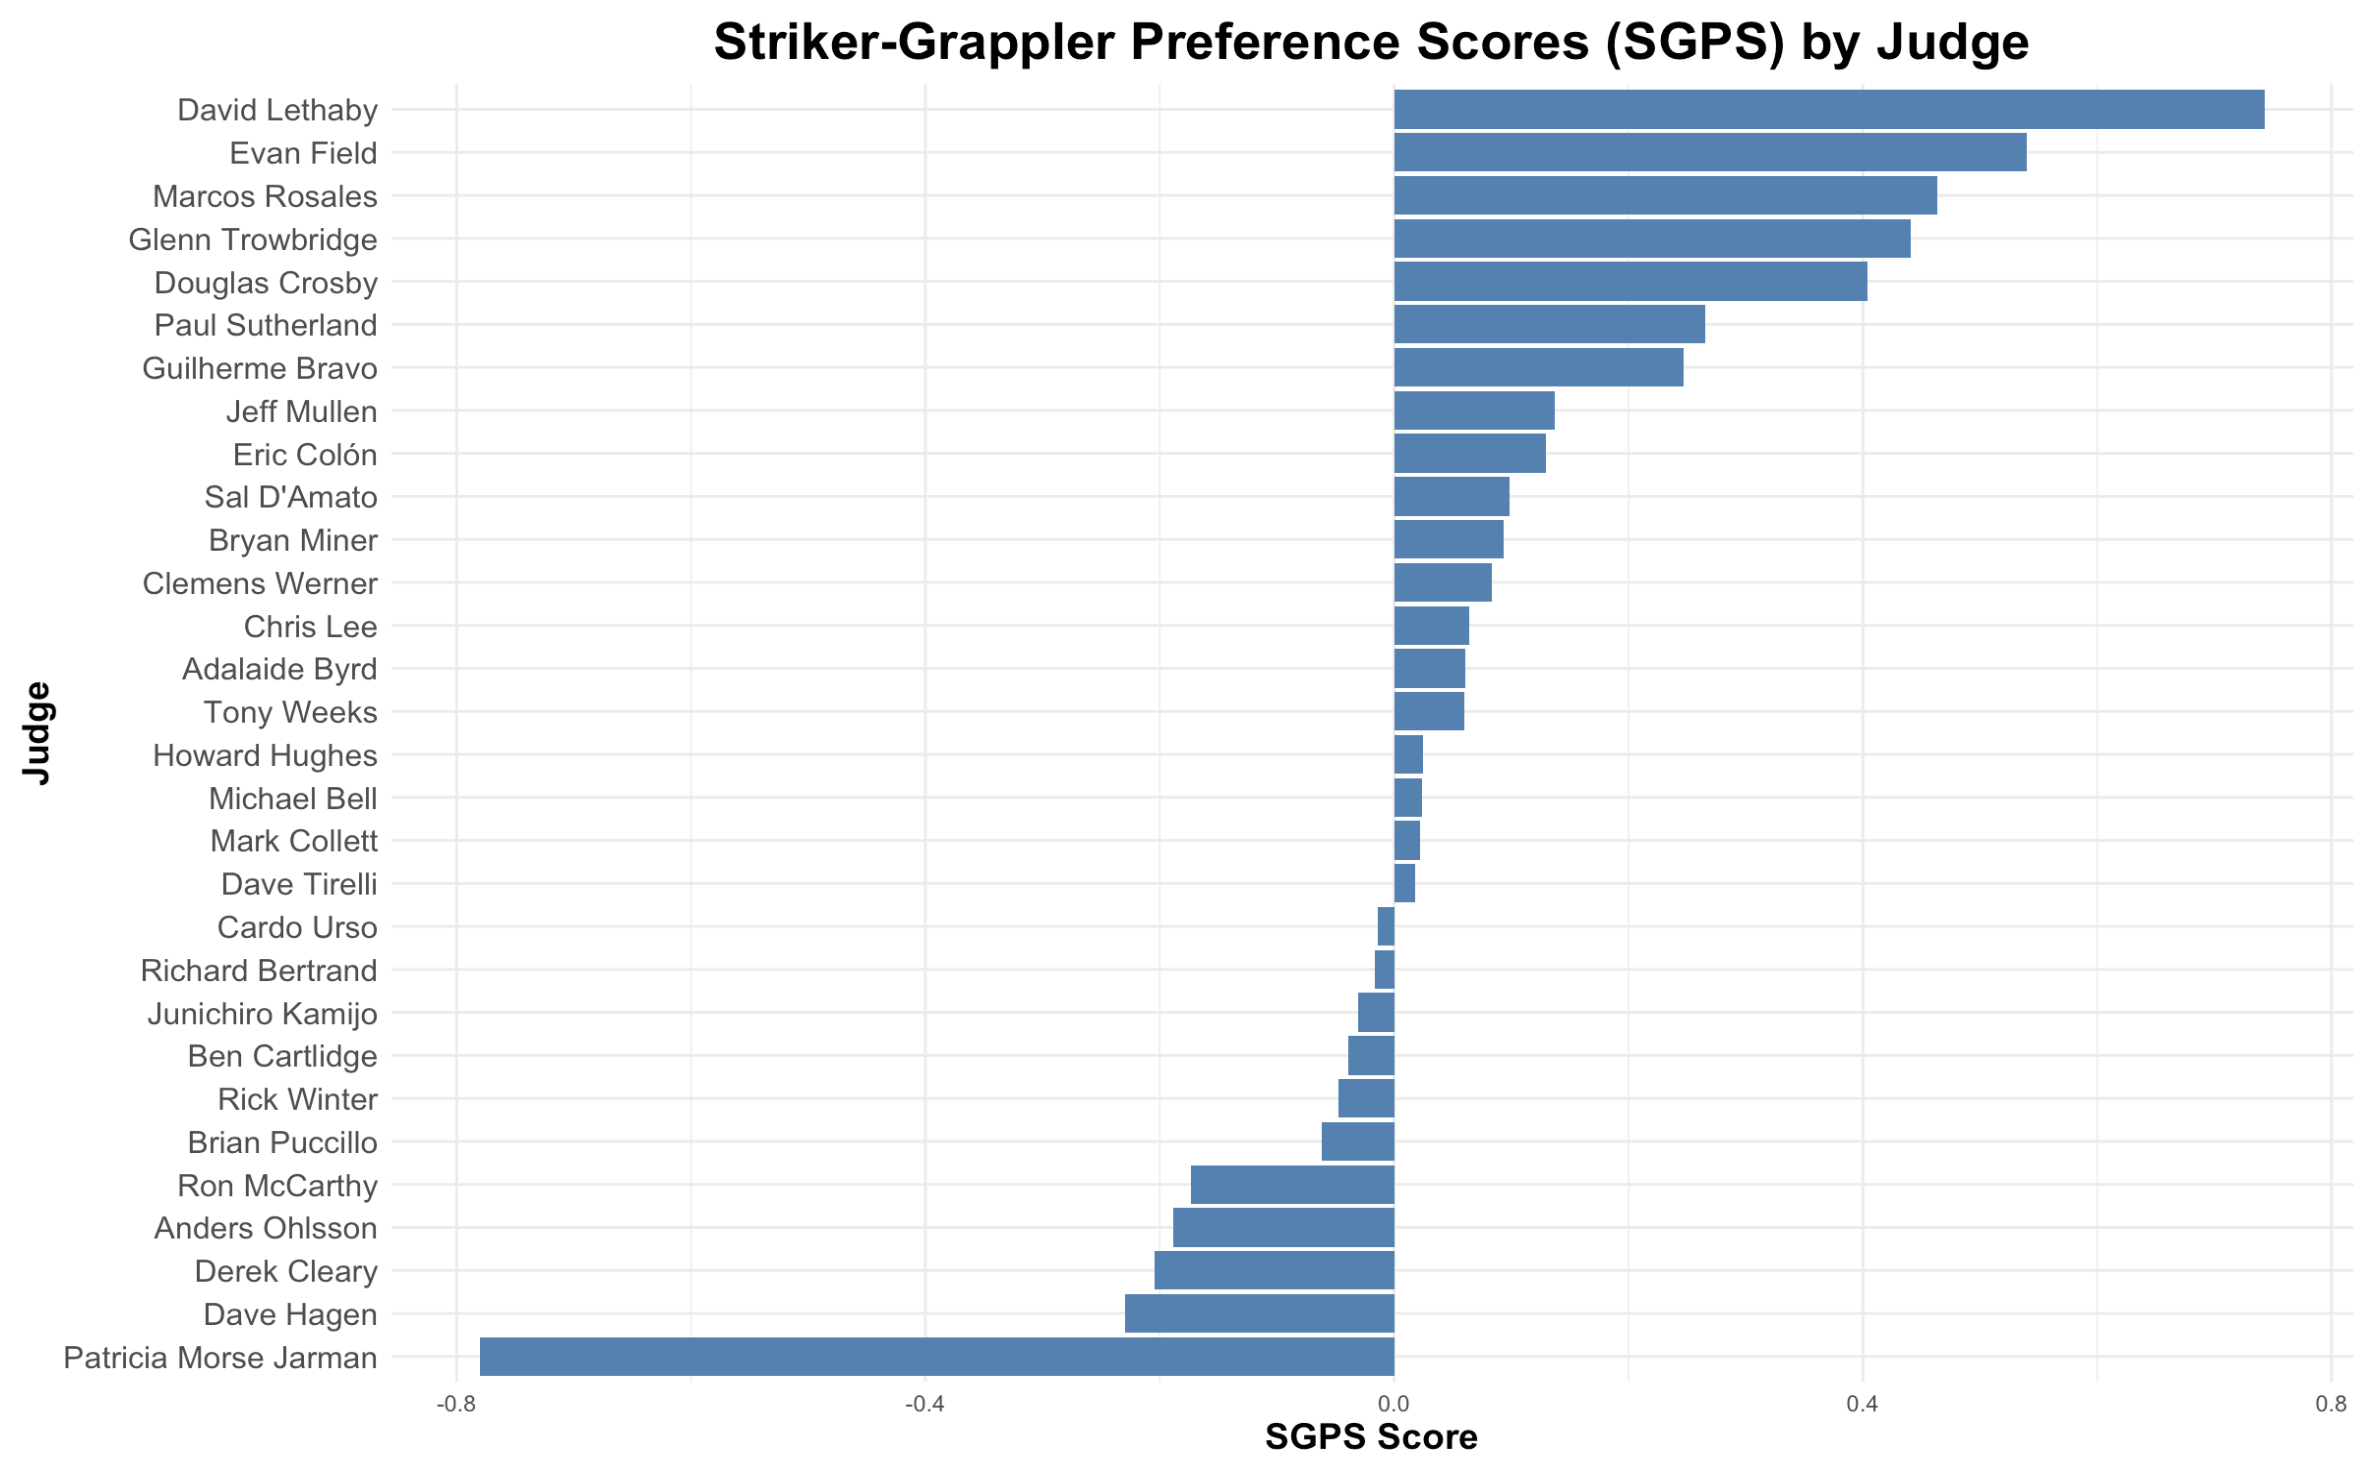
UFC Judge Style Preference (judges with bars on the right prefer strikers, left prefer grapplers)
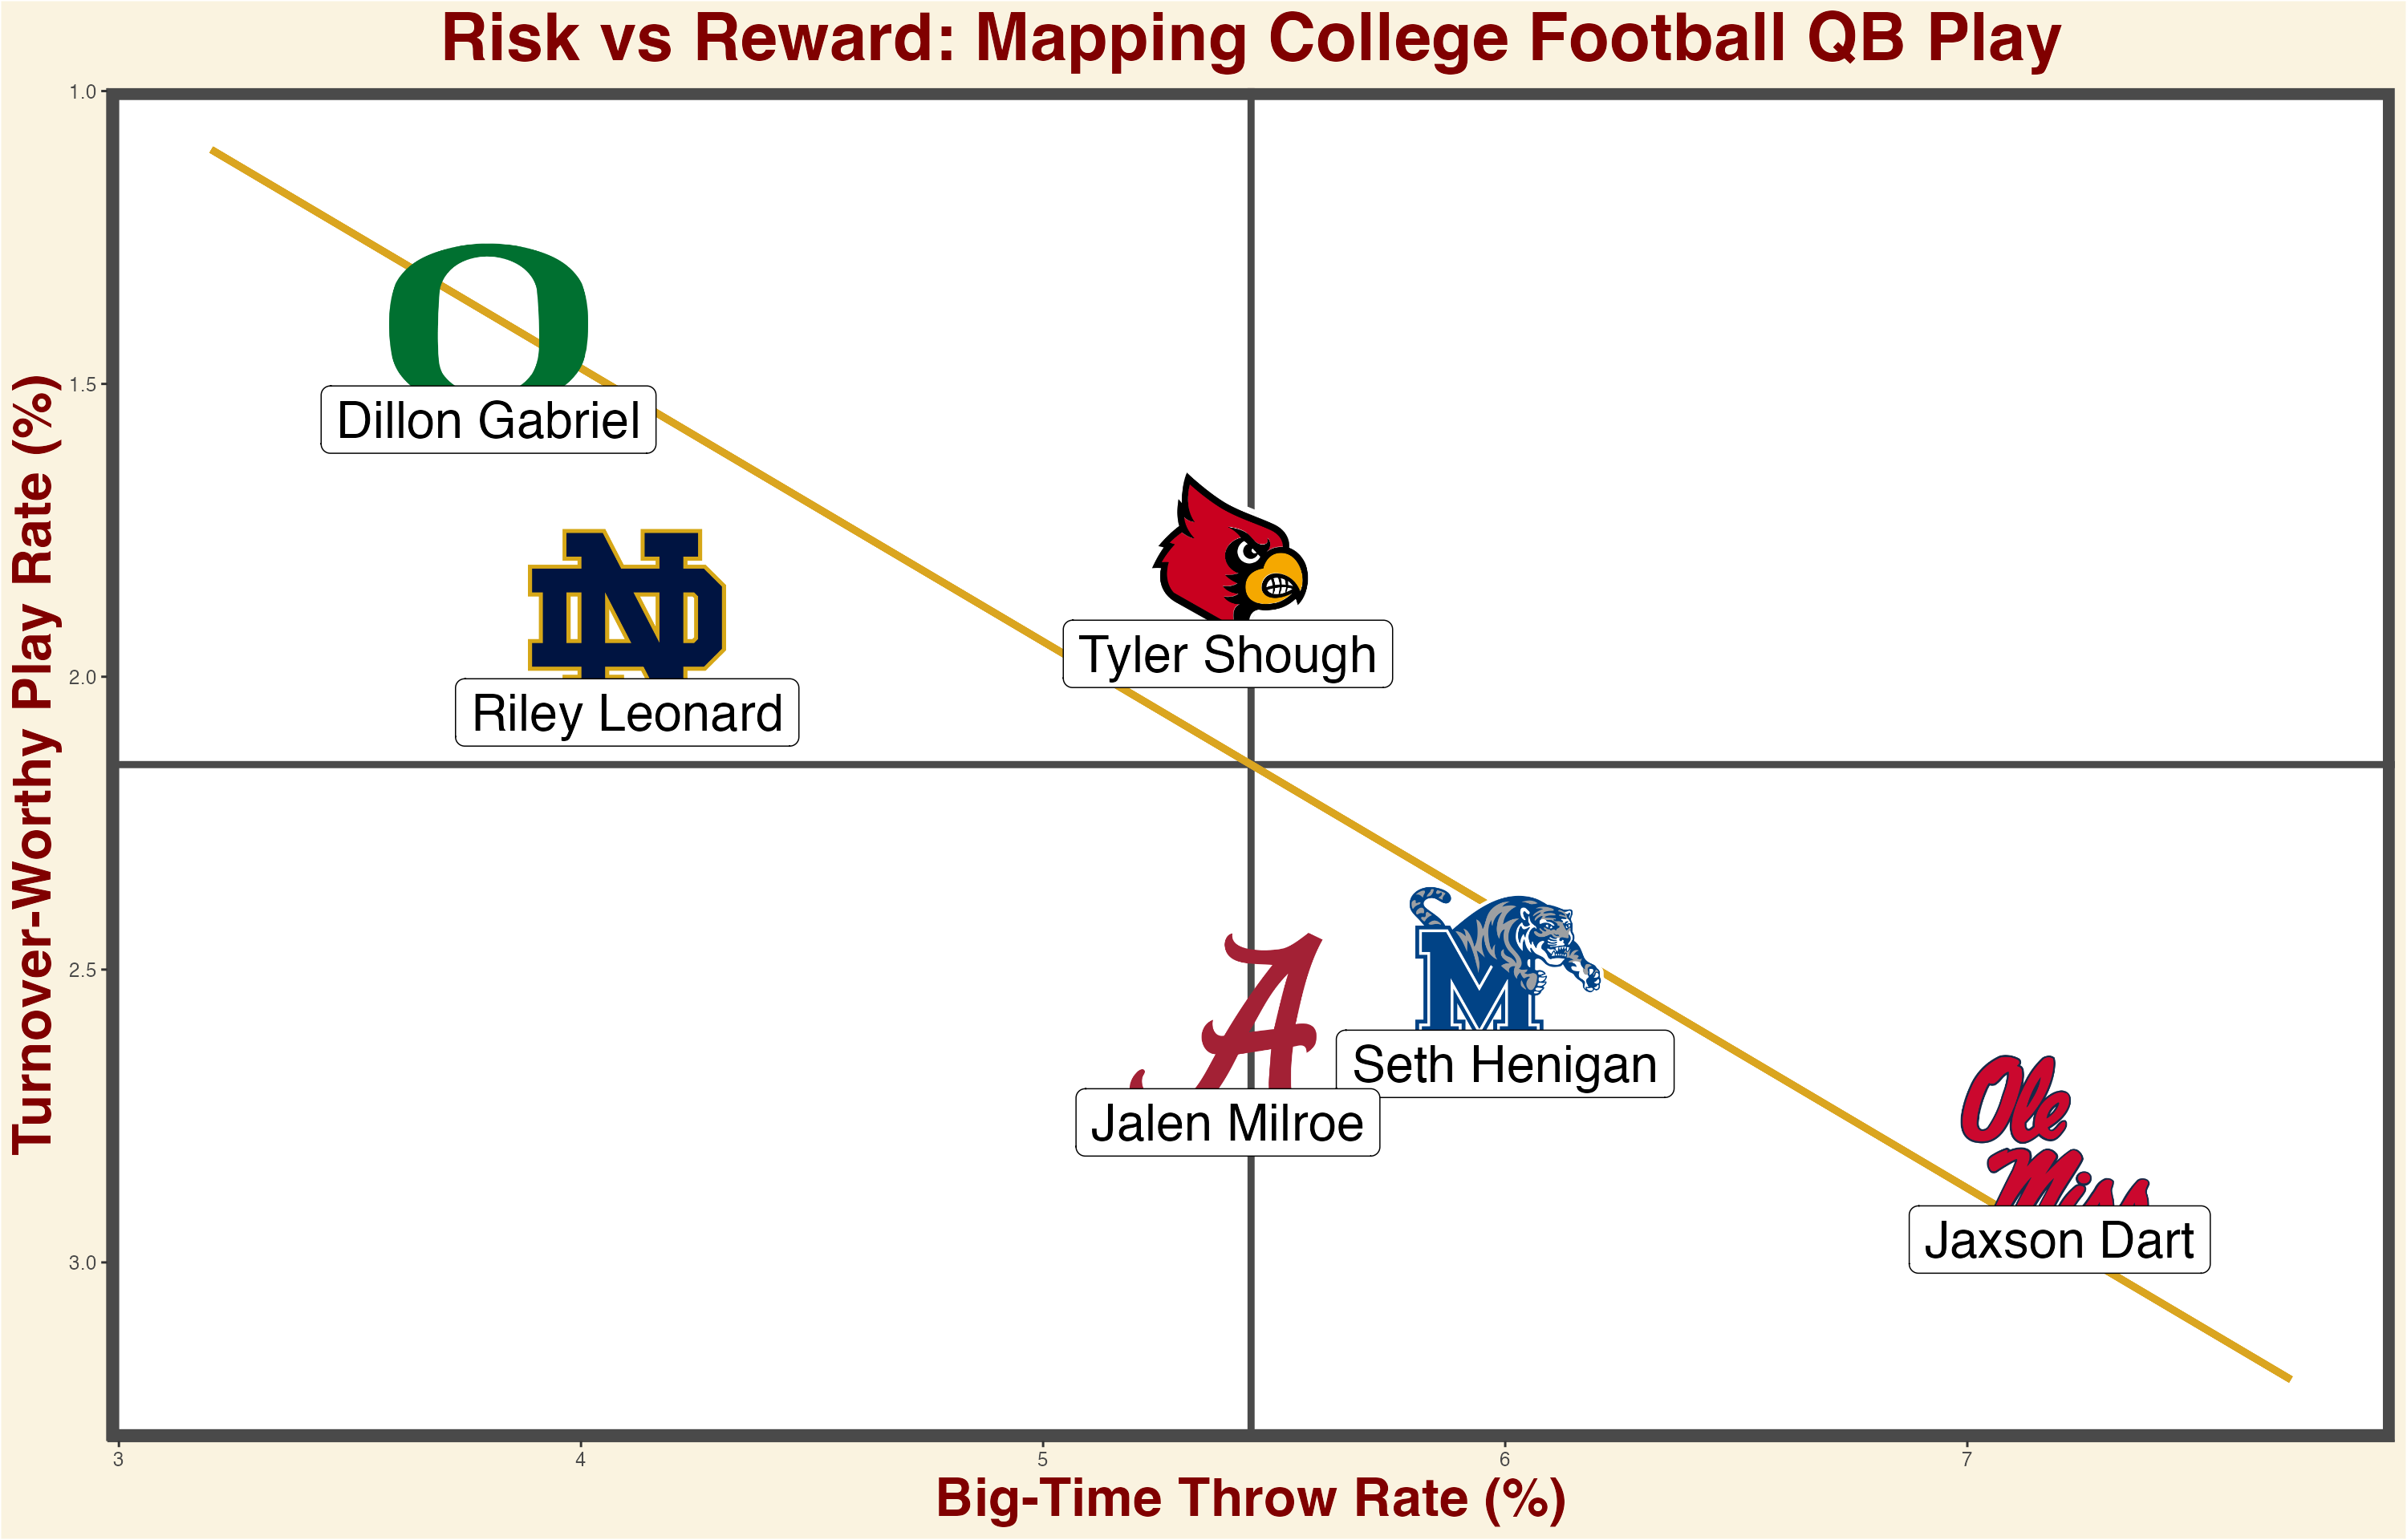
NFL QB Analytics:
Created using the ggplot2 package in r
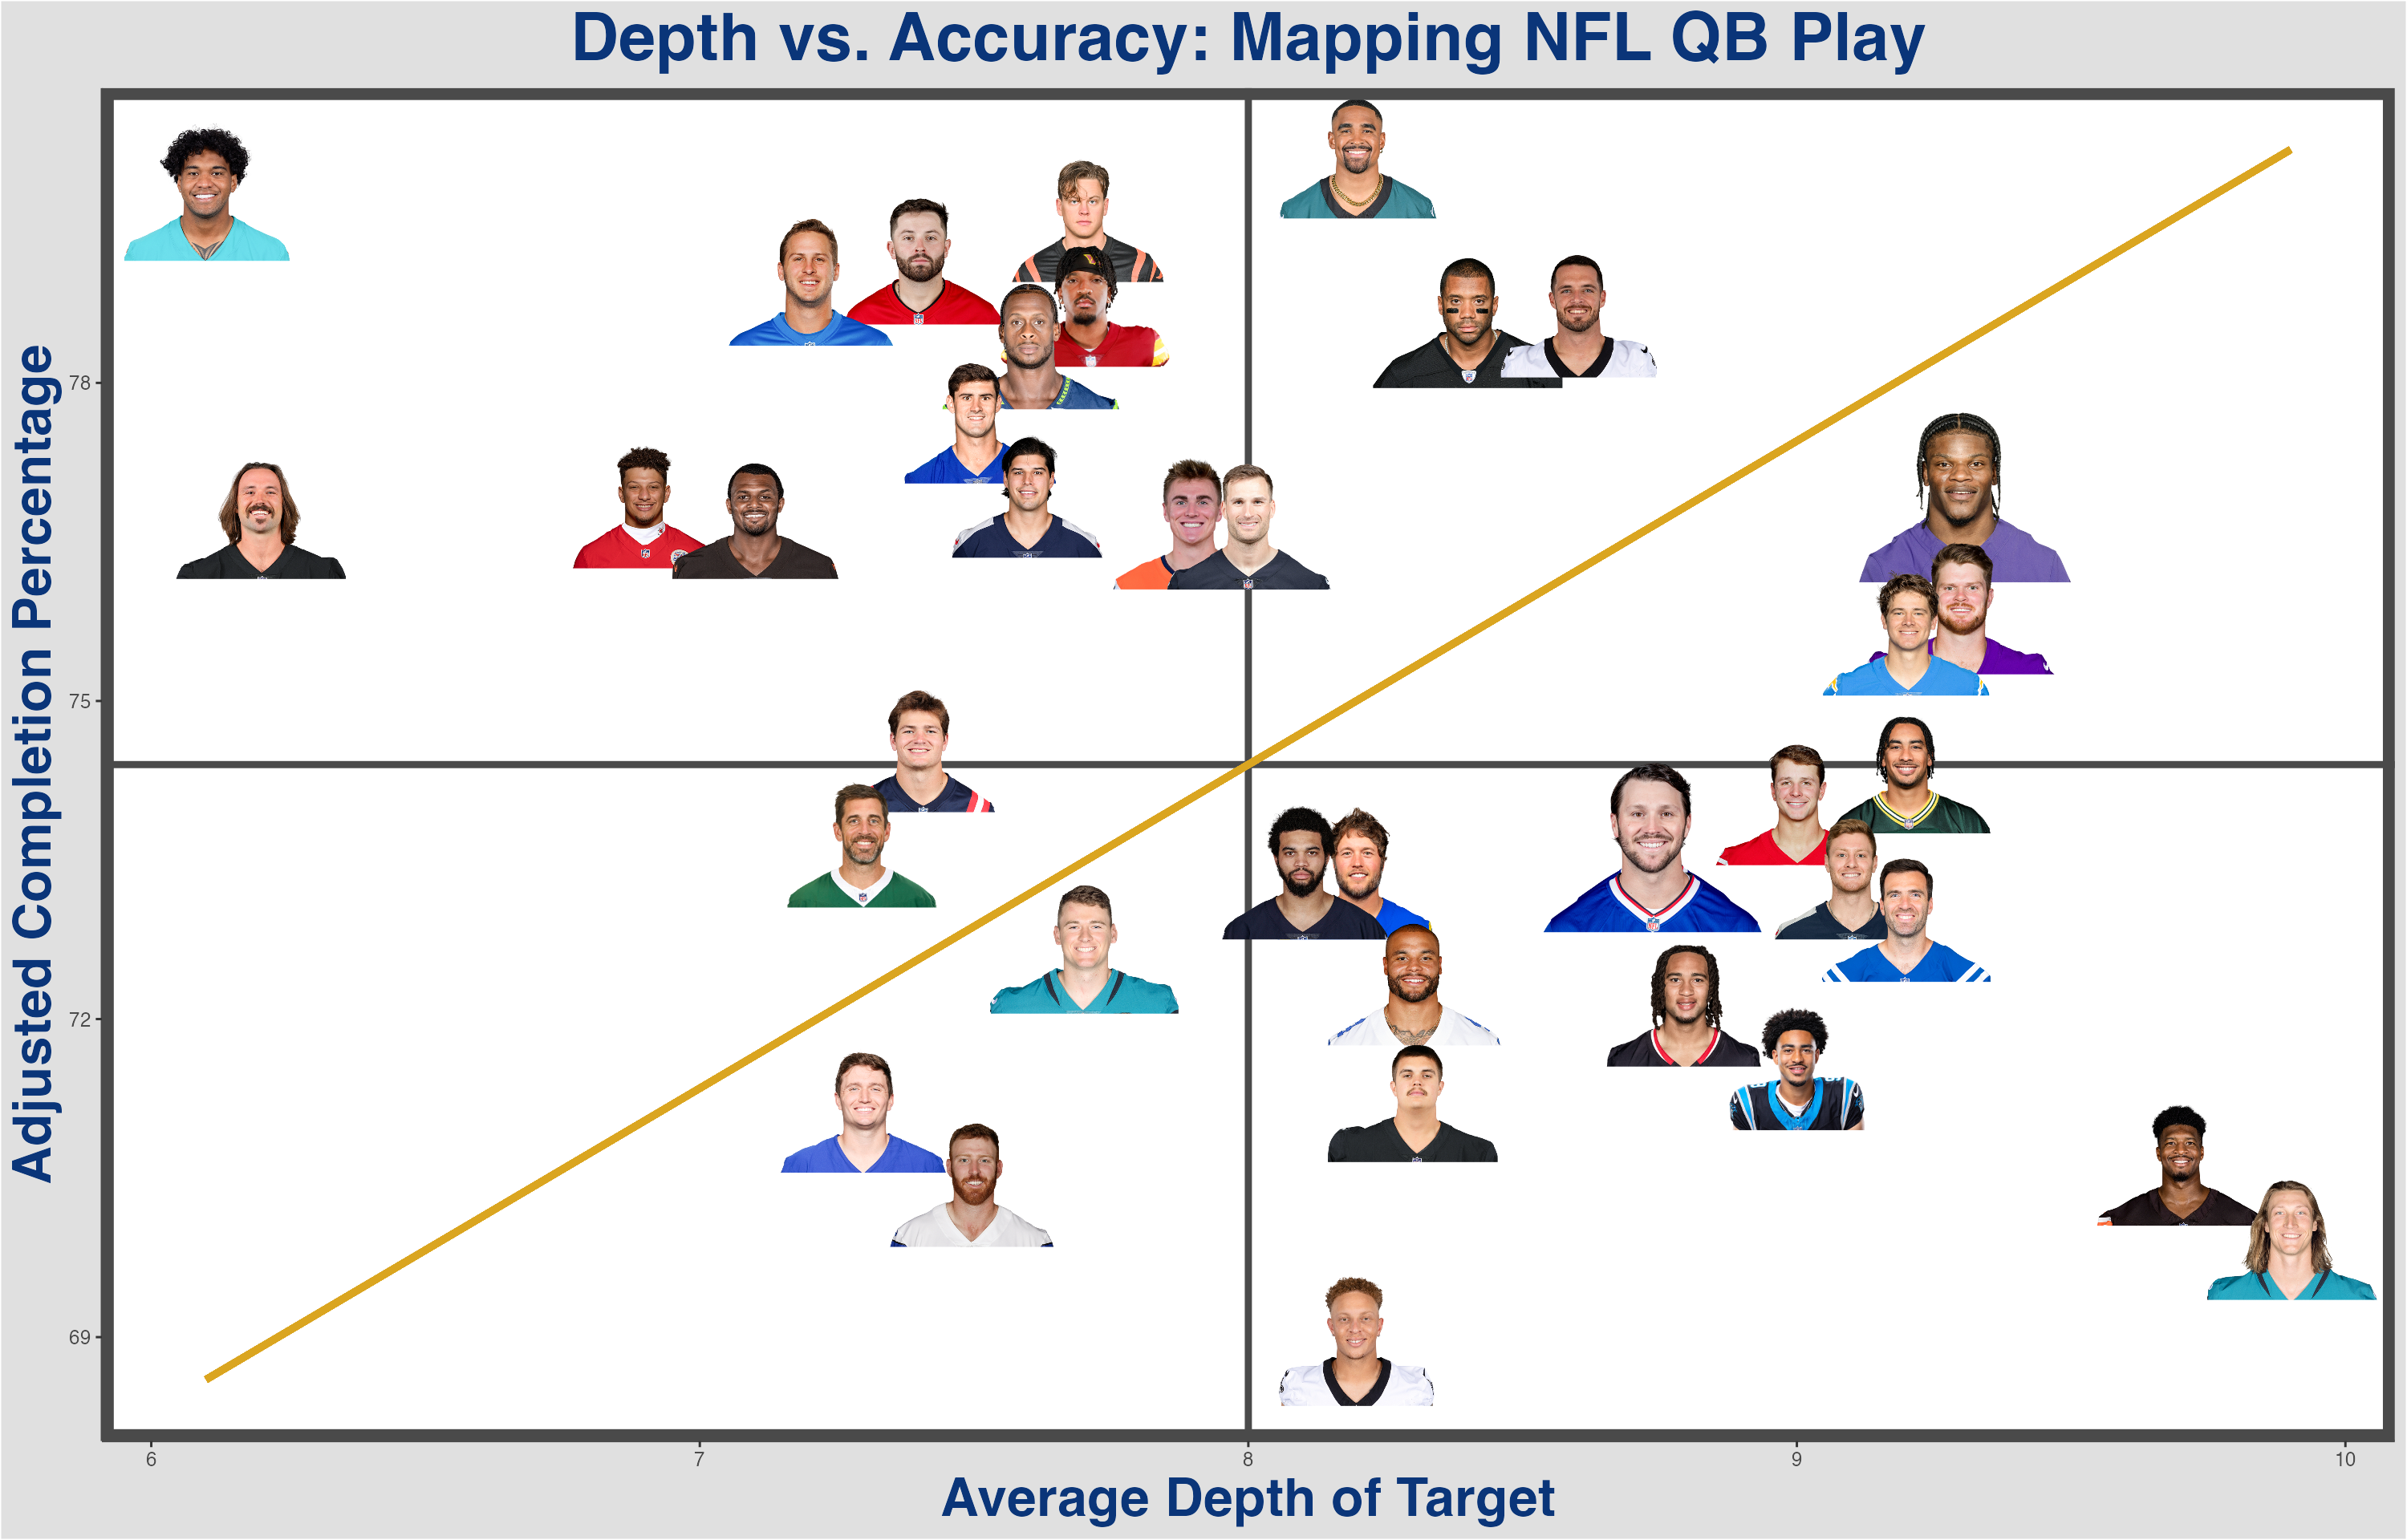
Mapping QB Performance & Style:
Examining NFL QB Aggresiveness:
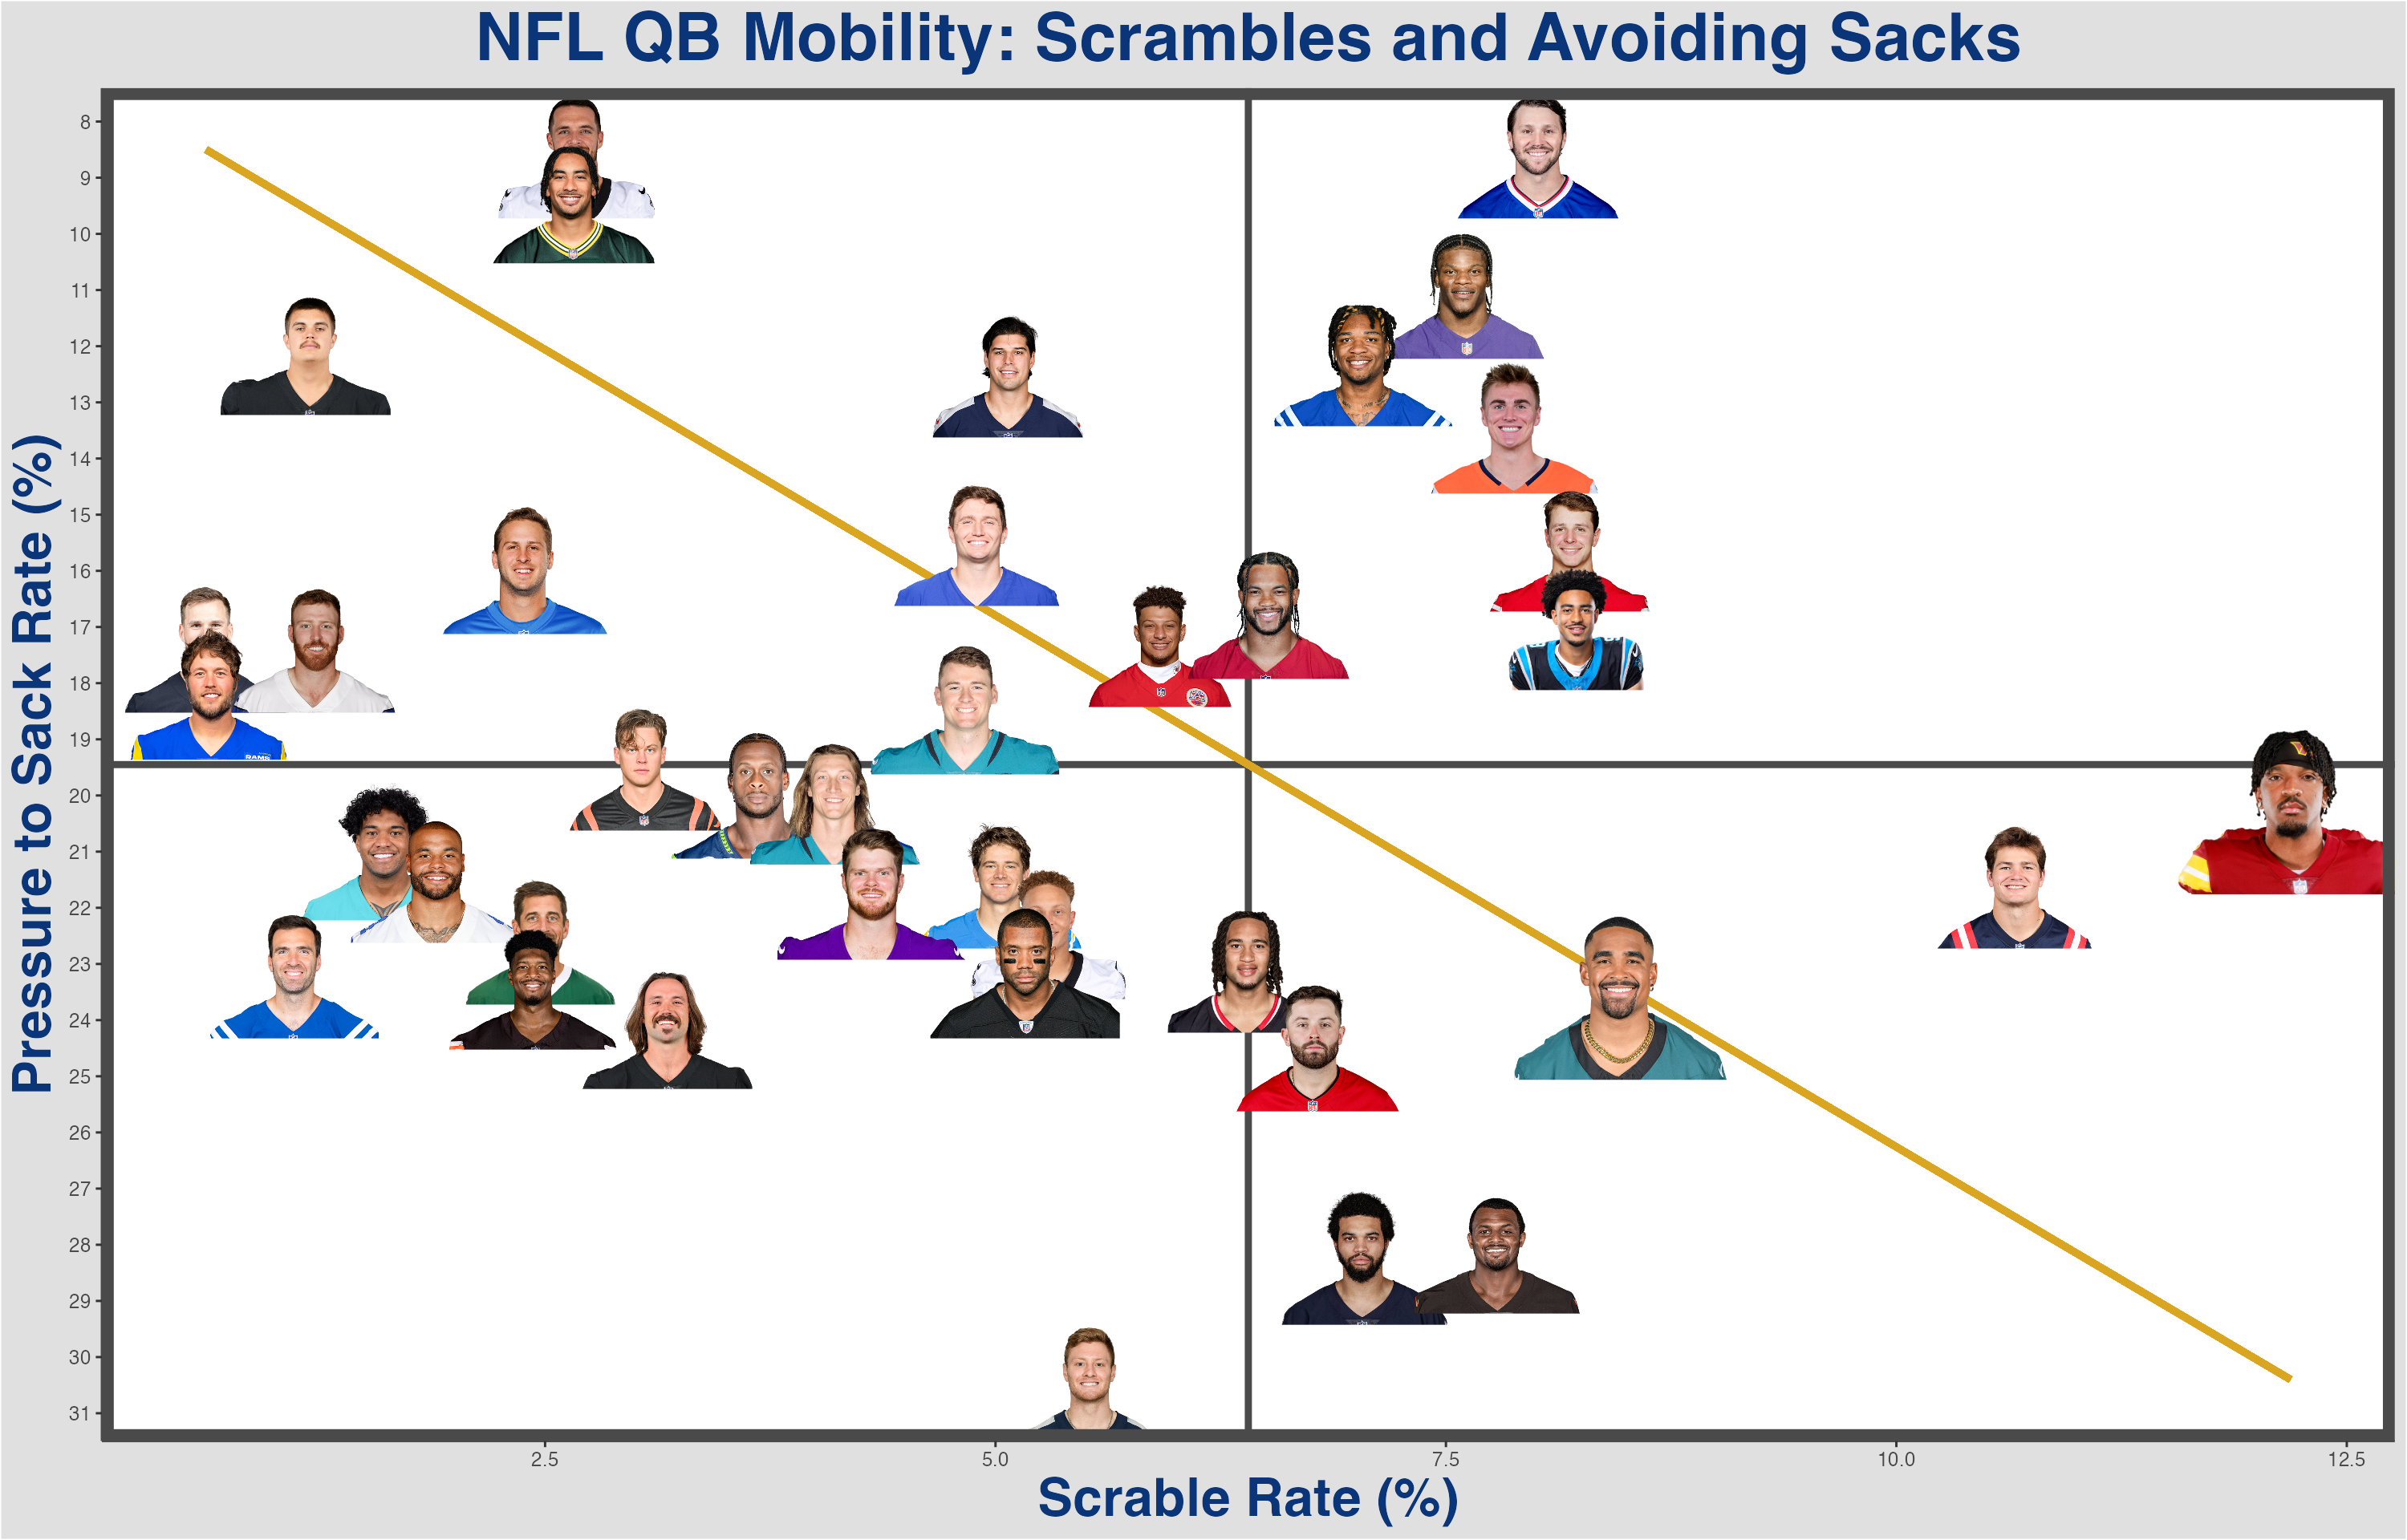
NFL QB Mobility:
Graphing Senior Bowl QB Play Styles: